Submitted by whjkhn t3_11ak0bo in dataisbeautiful
Submitted by whjkhn t3_11ak0bo in dataisbeautiful
Crime and murders as a whole spiked from 2020 on in the United States. I don’t have a dog in this fight or know anything about the two but showing info like this is tantamount to saying “number pandemics between the two.” Kind of a correlation is not causation issue, isn’t it? (Genuine question, I’m not being snotty).
I agree, definitely need to control for the overall nationwide crime spike. On top of that this chart seems to show some increasing trend as it is though it’s hard to tell with the time axis being relatively short compared to the size of the increase in murders.
Exactly. With Lightfoot's datapoints being essentially entirely measured during the Pandemic (and the known, but still poorly understood, insanity of fluctuation in certain oddly specific crime rates nationwide during the Pandemic), and that roughness of granularity, I recommend rejecting this chart as useless.
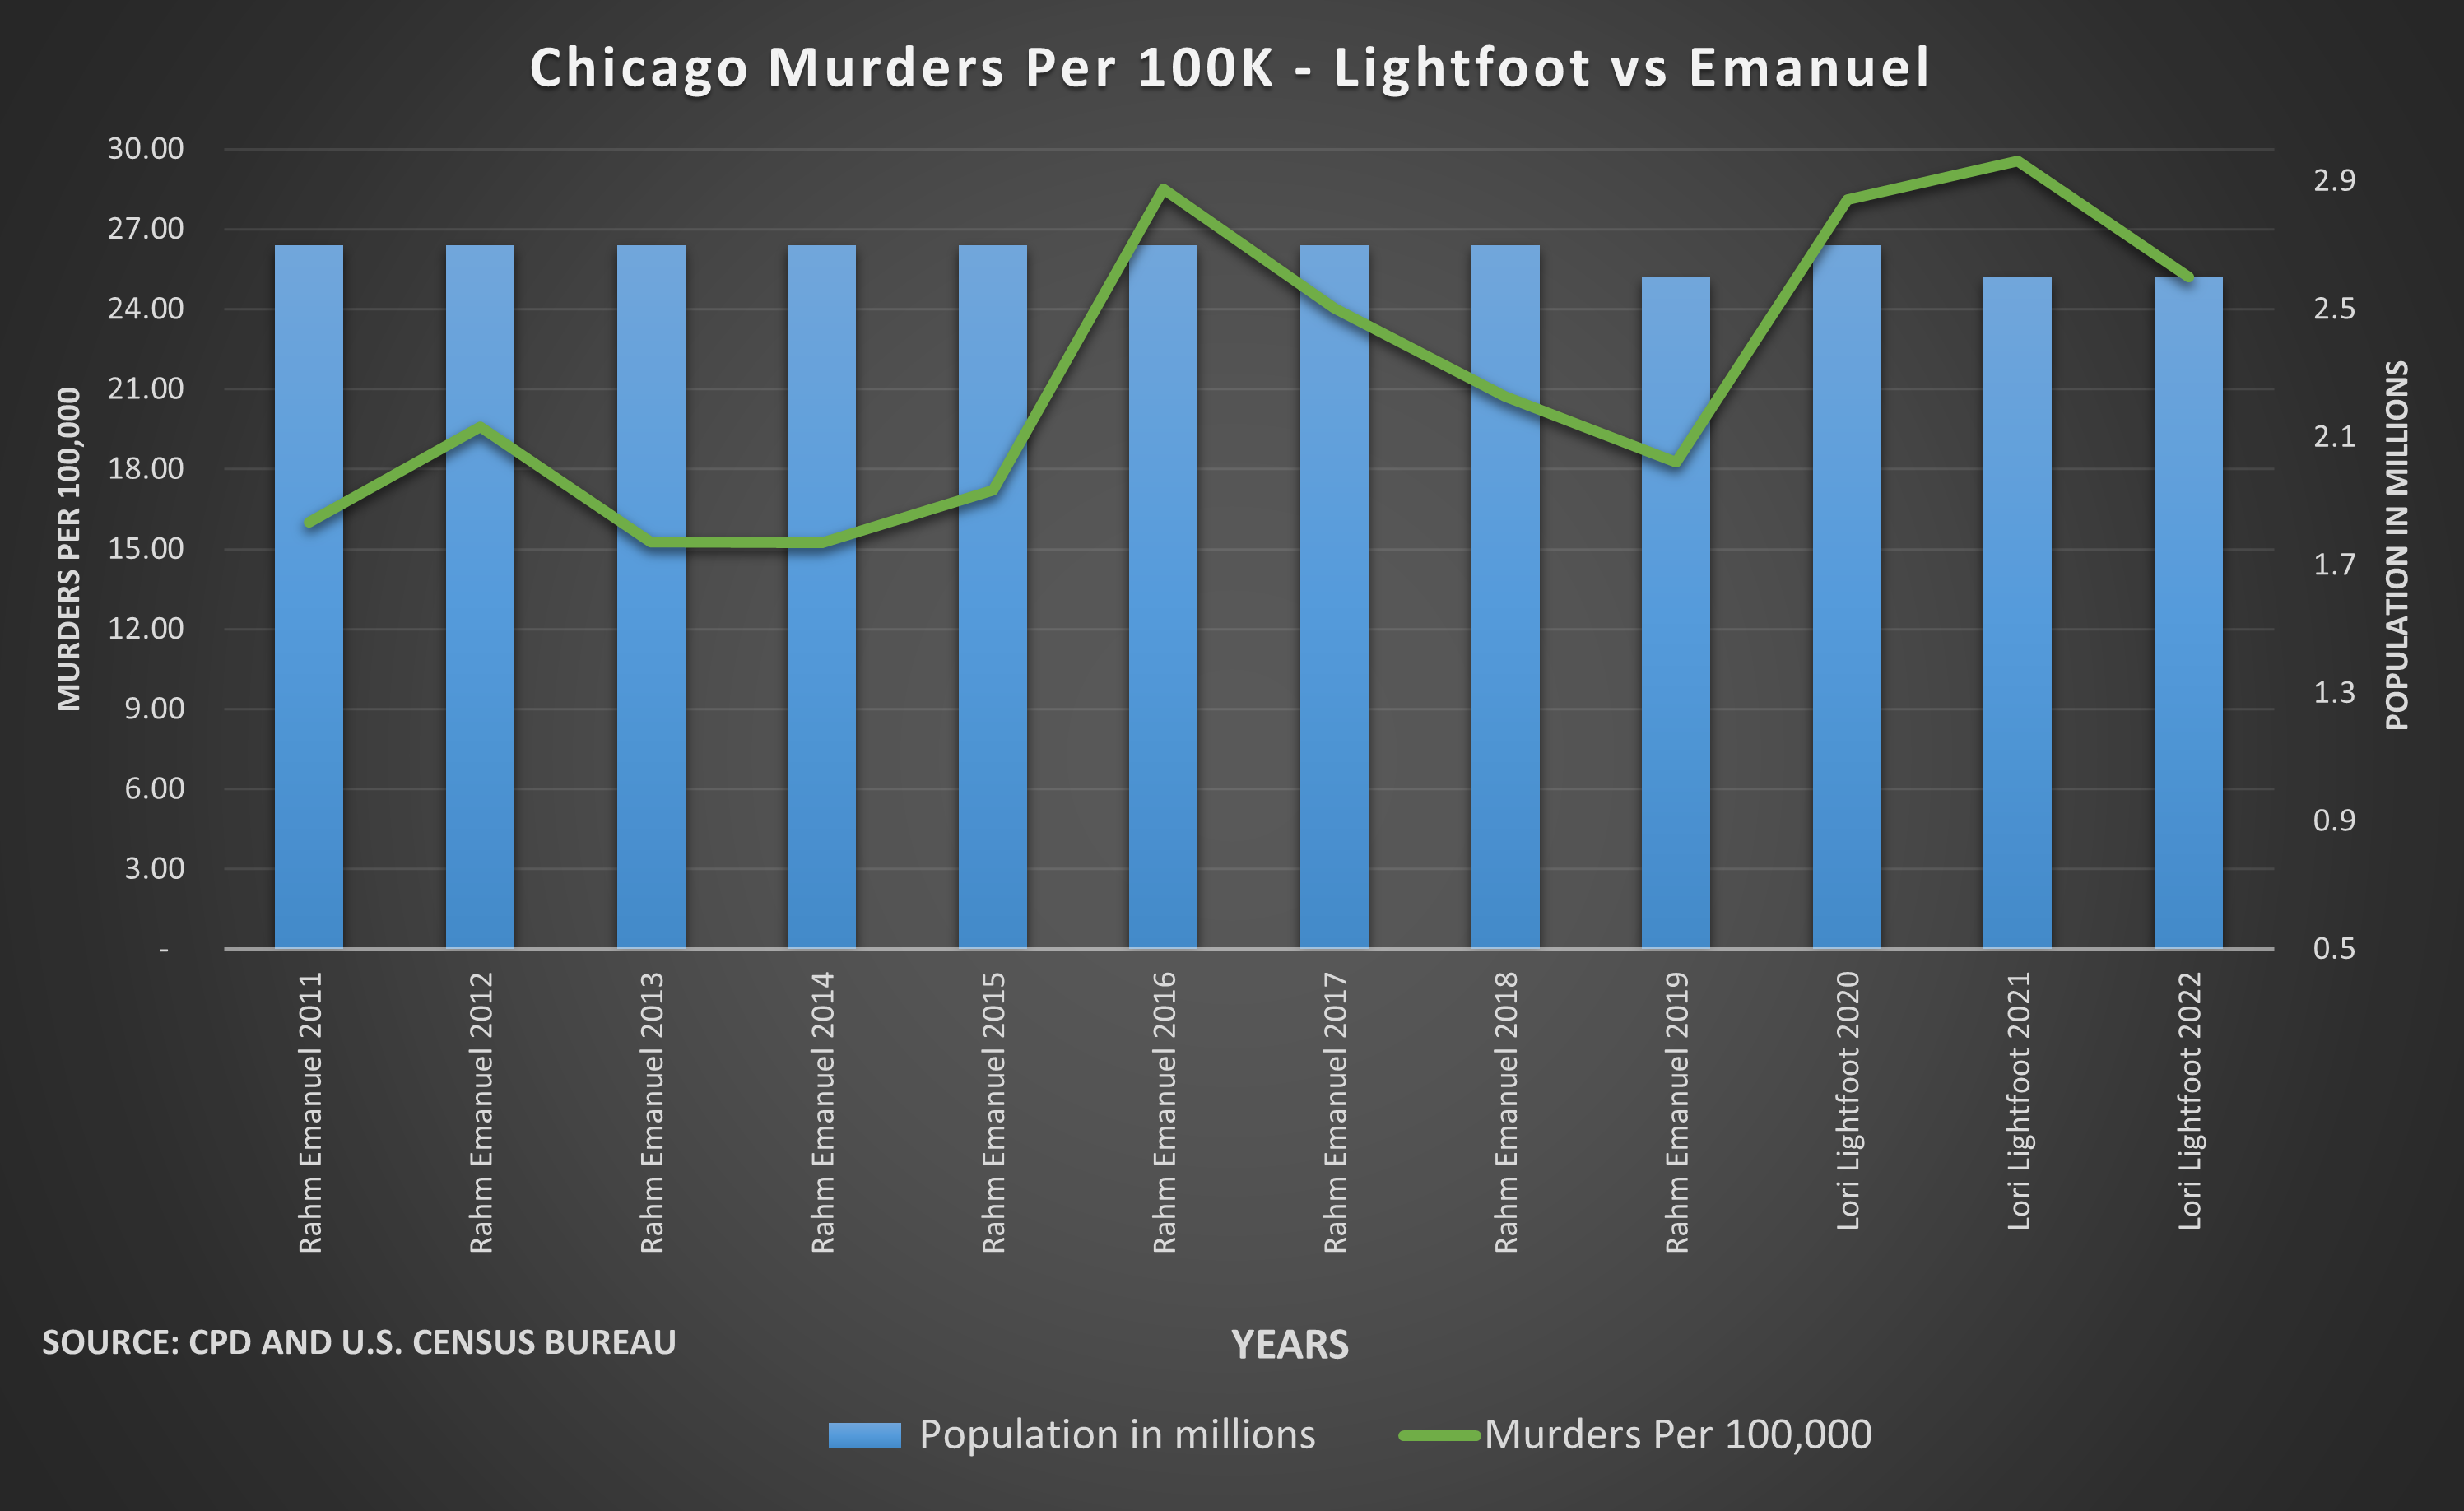
(This goes beyond the notion of evaluating one term of a mayor on 3 datapoints of a single crime metric compared to many more terms and many more datapoints of a previous mayor -- one basic problem of granularity is that each datapoint has a certain sampling bias depending on the cutoff -- you can see this yourself by recalculating the murder rate from daily statistics, but use a different year-to-year cutoff date -- that's one type of this bias. It's not a problem with more datapoints depending on the metric, but here you have only 3 for Lightfoot.)
Why did crime spike in 2020? Because of politicians like Lightfoot.
That’s an overly simplistic perspective. Crime spiked in most jurisdictions regardless of whether the government changed hands. I don’t know definitively if there is statistical evidence politics had some effect but distilling the crime spike to a single factor like this simply inaccurate.
They want the data to fit their narrative.
They should compare murders to the amount of money spent on the police department. Every election we here that crime is up and we need to spend more money to put more cops on the street.
We seem to do the same things over and over in the criminal justice area. We then say if we just spend more money we will solve the crime issue. Perhaps we need to rethink what we are doing and try something else?
I read that as murders being a problem that nobody has figured out.
Has been a general huge surge in crime nation-wide since around 2015. It became more apparent and escalated in 2020 after the summer of love but it's an issue nobody is really addressing.
This seems more like using context free data to push an agenda.
Seems to spike with presidential elections tbh
Instead of the bars, maybe graph the national or urban average instead?
Correlation doesn't equal causation 😉
Source: CPD & U.S. Census Bureau
Tools: MS Excel
CPD have been known to cook stats though.
https://www.chicagomag.com/chicago-magazine/chicago-crime-statistics/chicago-crime-rates/
[removed]
The Chicago mayorship is literally the most corrupt position in the country.
Ha ha ha ha ha ha!!!!
(Source: New Jersey)
I thought they just made the corruption legal in New Jersey.
Nah, Illinois governor takes that crown.
"Hey before I commit this murder, is the mayor woke??"
[removed]
logank013 t1_j9soe4y wrote
Just a quick tip, including the population bar graph doesn’t really need to be there since you already normalized the data per 100,000 people. That’ll help make the graph a little neater.