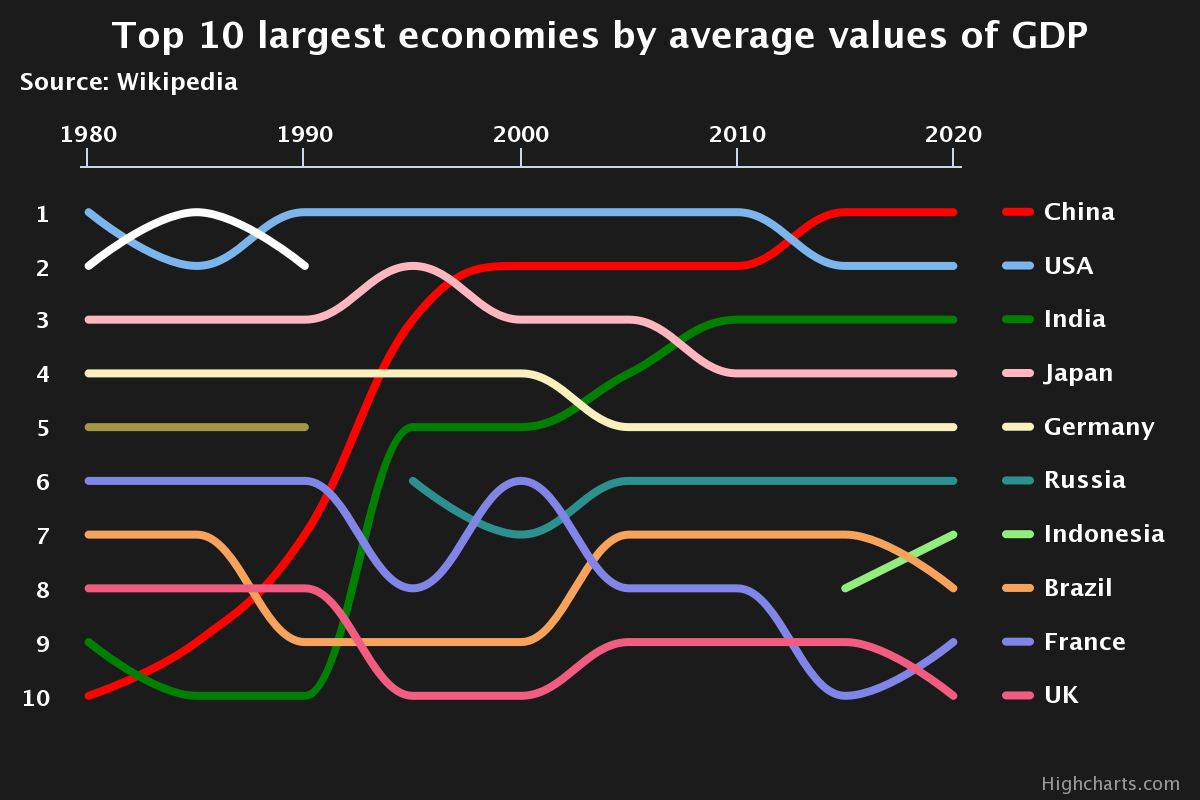
 [OC] Top 10 largest economies by average values of GDP
Submitted by highcharts t3_111y1po in dataisbeautiful
ismaelsow t1_j8hnhpa wrote
What does "average value" of GDP mean?
ferrel_hadley t1_j8i3578 wrote
They are taking the average GDP adjusted for Purchasing Power Parity over 5 years. The problem is I am not sure PPP works for total GDP, it is meant to reflect the differences in consumer income i.e. how far a consumers wages will go. So someone in the US on say $50 000 may only be able to buy the same amount of goods as someone in country x who is on $40 000 because consumer prices are lower.
But it relies on a basket of consumer goods, so I really don't think it works scaling to GDP as a large part of GDP calculations are not in a sample consumer basket and if you exclude things like property (which is insanely expensive in China) you can end up with wild distortions.
droolingdonkey t1_j8i4q2q wrote
Haha then this chart is even more false. My money as a scandinavian would go longer then the avarage Russian. Holy smokes what a shit measurement.
svn380 t1_j8w96p5 wrote
Are you sure they're using PPP?
I didn't see that info and was wondering....
[deleted] t1_j8hti19 wrote
[deleted]
khalcyon2011 t1_j8hya2m wrote
Yeah, USA's nominal GDP is about $7 trillion more than China's, and the per Capita GDP of the US is much higher. There's some serious shenanigans going on here to put China about the US.
ale_93113 t1_j8k2n7z wrote
Lmao, gdp ppp is what is used to calculate gdp growth figures you see all the time in the headlines
It's been the way to correct for currency fluctuations since the 1960s
How is it a manipulation to put china in top?
Viewing a single comment thread. View all comments