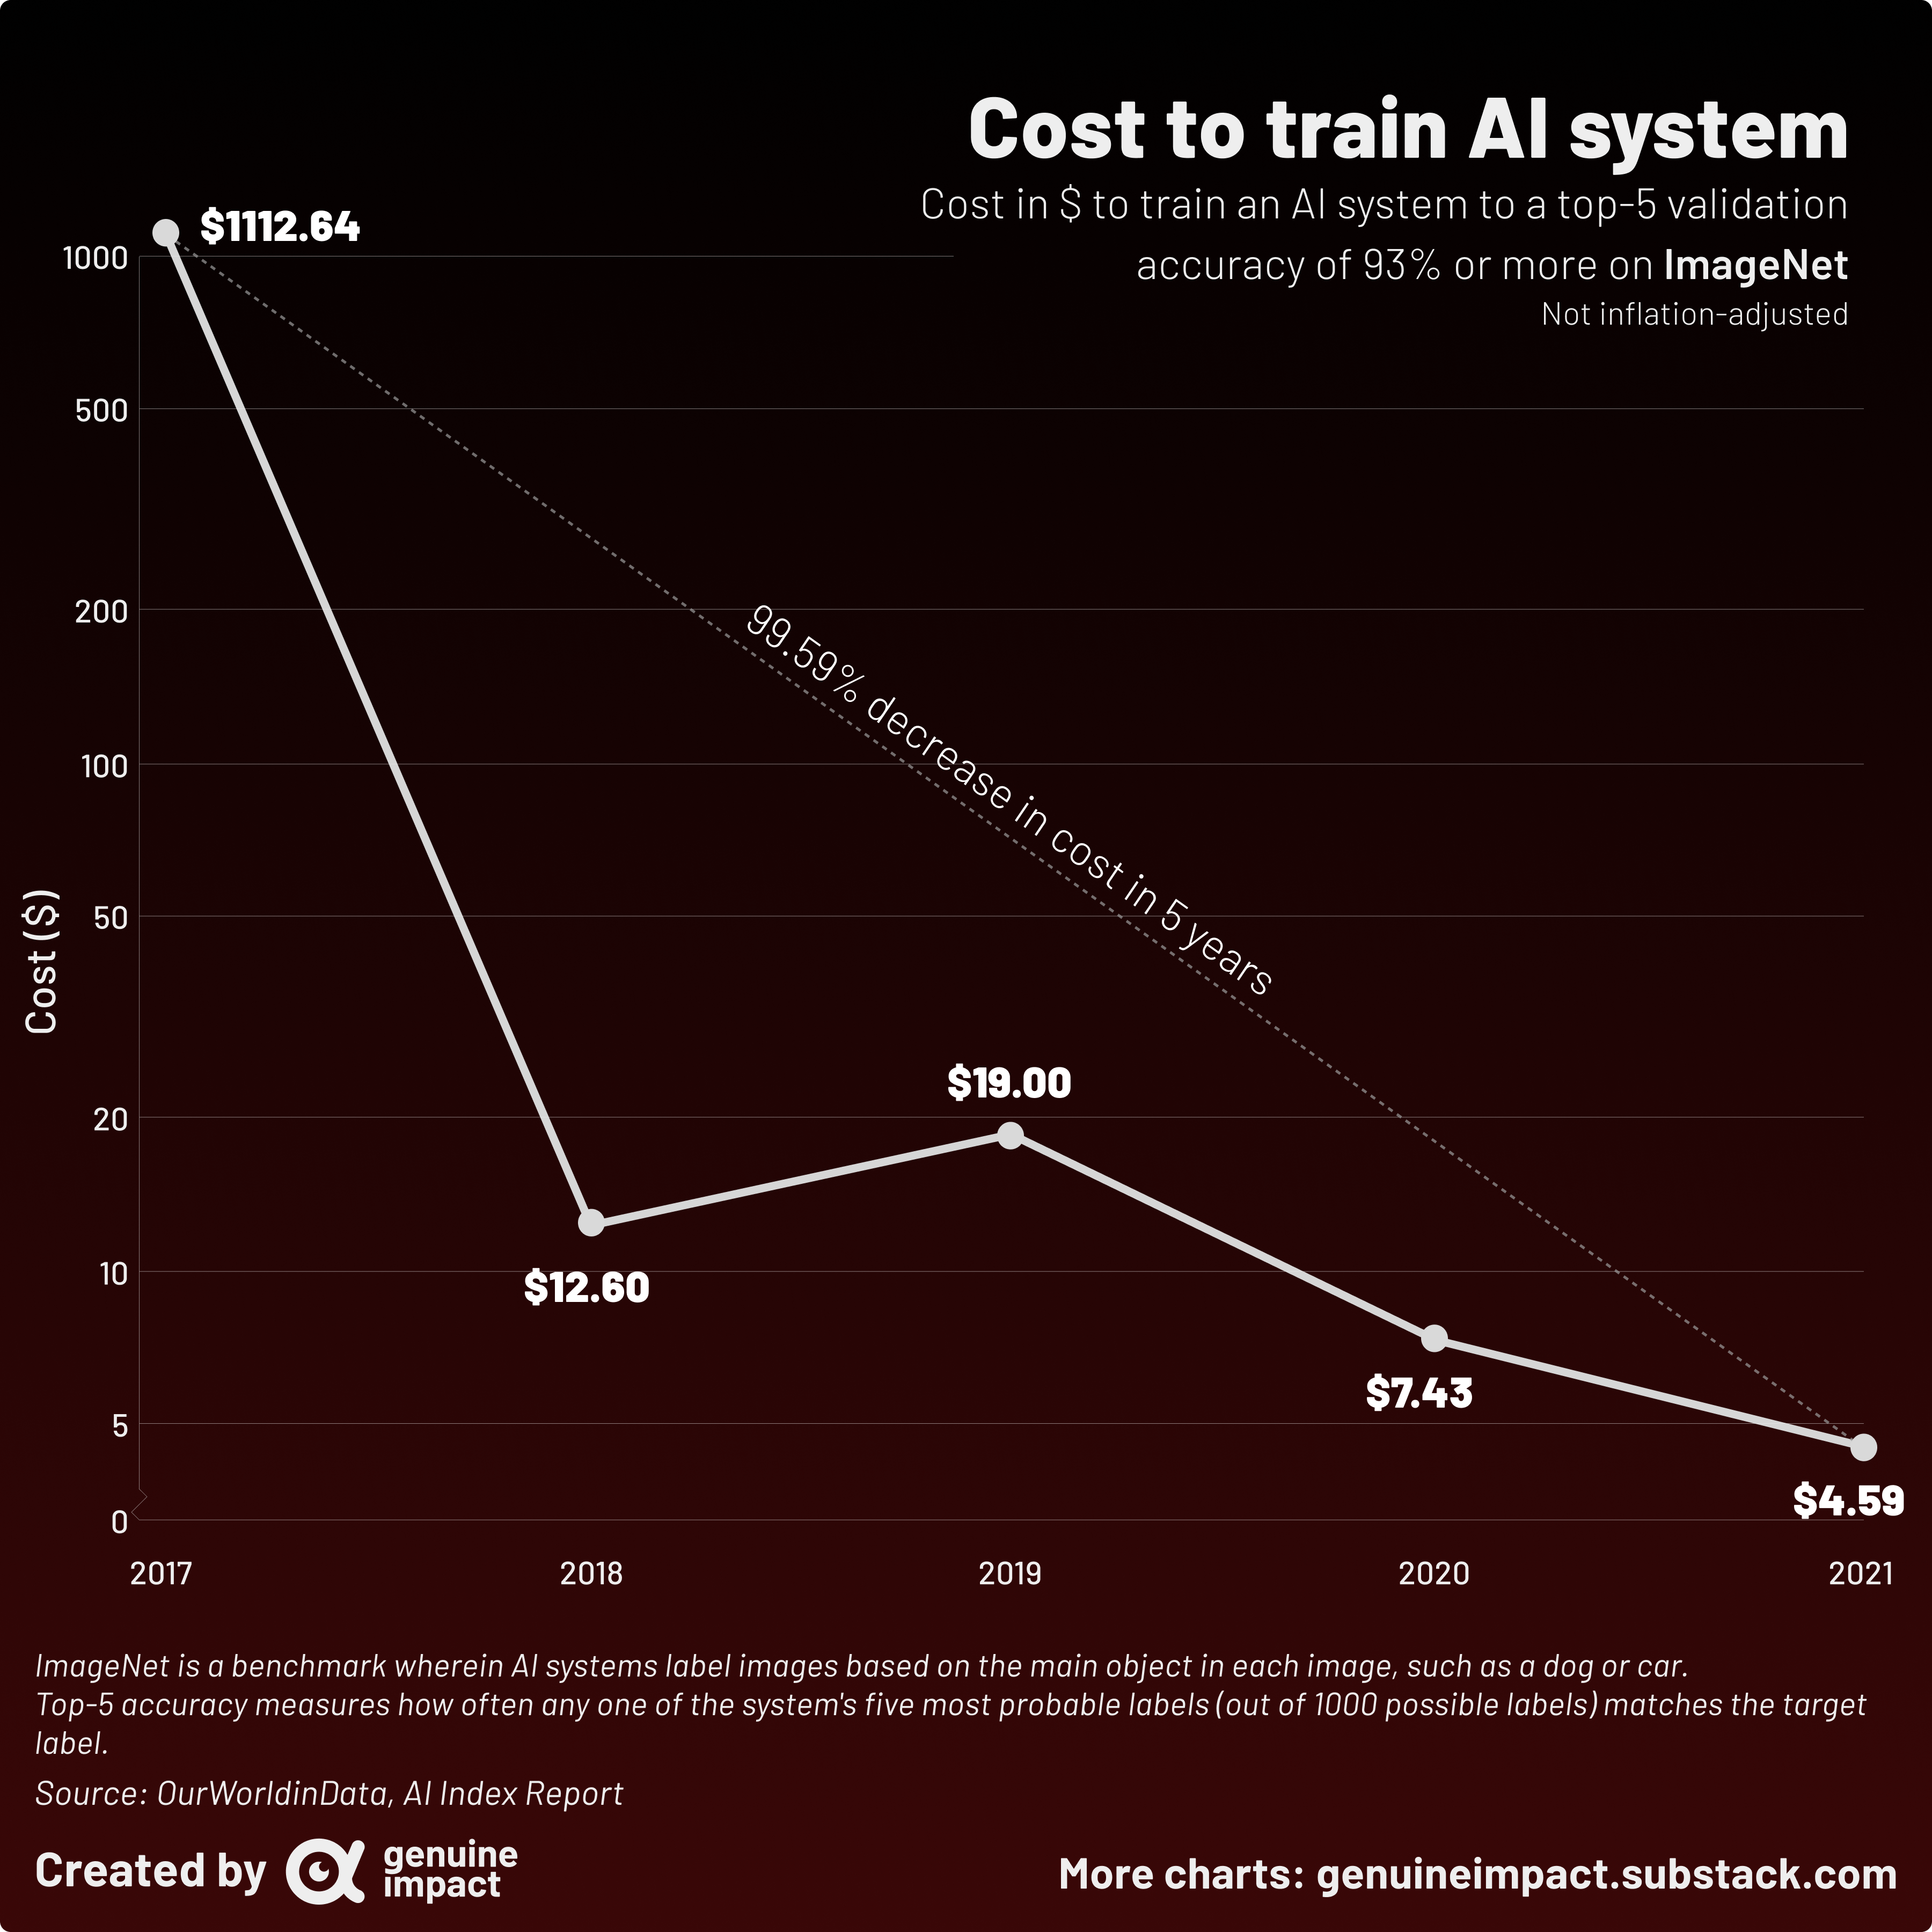
 [OC] The cost of training AI on ImageNet has decreased from over $1000 to just under $5 in just 4 years
Dykam t1_j8wm1ju wrote
Reply to comment by Dykam in [OC] The cost of training AI on ImageNet has decreased from over $1000 to just under $5 in just 4 years by giteam
There's some sense to having the second trend (2018-2021) visible, but it should be on a different graph, the two data pieces are not really compatible.
Utoko t1_j8wo1zf wrote
or leave it at log scale and it is completely fine. It is labeled where is the issue?
We can make 3 post about it split it up zoom in and out or just use log scale...
Dykam t1_j8wpt3m wrote
Because the image actually makes a separate point of saying "99.59 % in 5 years", which isn't all that interesting as it's almost the same %, 98.92% in just the first year. In a way, it's presenting the data in a way making it less impressive than it is.
This is /r/dataisbeautiful, not r/whateverlooksnice, so critiquing data presentation seems appropriate.
Utoko t1_j8x123v wrote
but your suggestions to split it up in multiple graphs is far worse or only show data from 2017 and 2018.
Than everyone would wonder how ho wit developed after 2018.
You can make the same claims about every stock market chart which is displayed in log scale. "These movements don't matter because 96% of the growth was in the past."
but the recent development is very important too. In this case that it still continues to go.
It is still down 35% in the last year, which lets you see we are not even close to the end of the read.
One might argue the 98.92% decrease says a lot less because when something is not done in scale it is always at first extreme expensive. So I don't agree that they make it look less impressive than it is.
So as long as your point is people don't understand how to read log charts I still disagree with you.
ChronWeasely t1_j90b0of wrote
The "trend line" with the attached conclusion is what makes it egregious and masks the logarithmic nature of the y axis. Like it misses the important points with overfitting.
And the interesting thing is two things
- in one year, prices fell by 99%
- in subsequent years, prices have fallen another 60%
But it makes it look like there is a continuity that in reality doesnt fit a trend line at all as is seen in the non-logaritmic version
[deleted] t1_j8z2cni wrote
[deleted]
Viewing a single comment thread. View all comments