Submitted by elijahmeeks t3_11esh1j in dataisbeautiful
Submitted by elijahmeeks t3_11esh1j in dataisbeautiful
[removed]
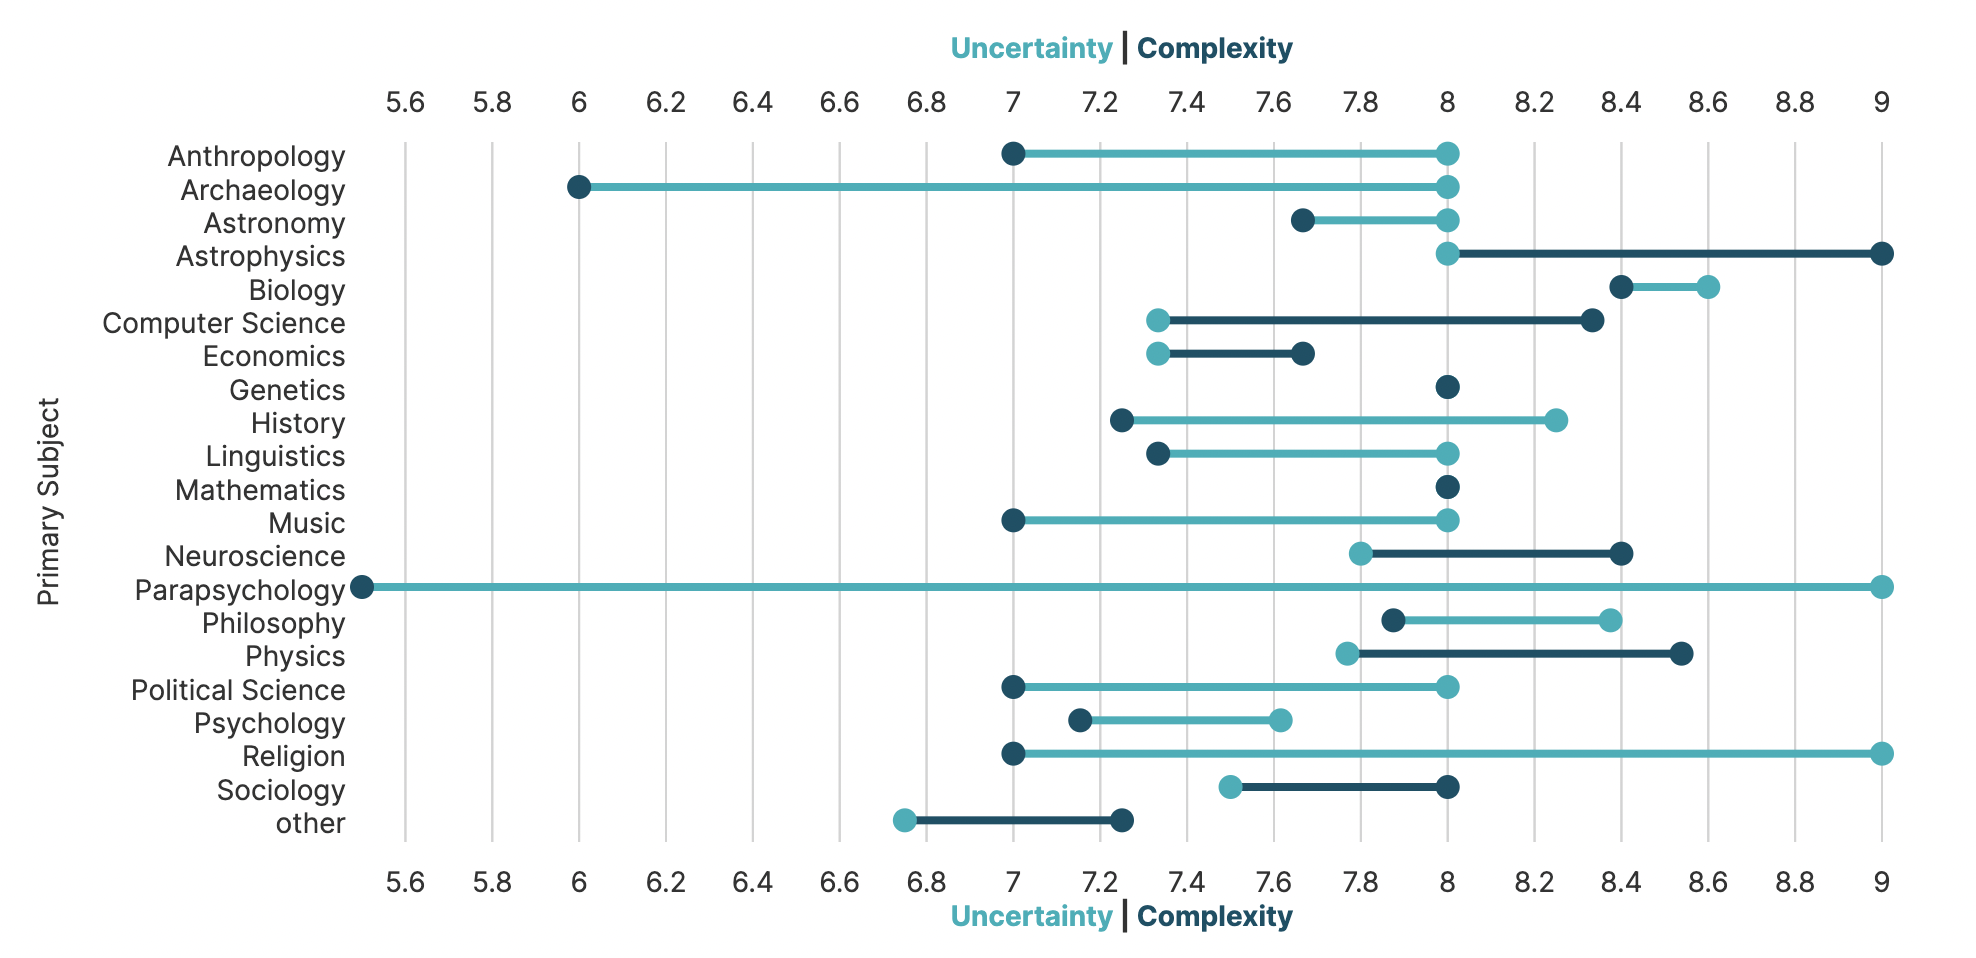
I asked ChatGPT to give me a list of topics that were too complex or uncertain for it to discuss without being misleading and made a bunch of charts out of the results. This is a nice overview Dumbbell plot of the subject areas of the 100 topics that ChatGPT gave me but if you want to see some treemaps and word clouds you can check out the whole thing here: https://app.noteable.io/f/8e355d65-cd94-4afe-bb81-b9aa24a457dc
I used a Noteable notebook, which is Pythn+SQL. The data visualization uses their built-in tool DEX, which uses javascript with Semiotic and D3 under the hood.
Edited to add: This is a live notebook that you can interact with, explore, and export the dataset that I had ChatGPT create for me.
How is complexity judged, especially considering how so many of these subjects overlap?
The short answer: These ratings come from ChatGPT.
Long Answer: You'd have to read through the full exploration to see the entire picture. Basically, I asked ChatGPT to give me 100 topics too uncertain or complex to discuss without misleading users, and to give me subject areas for them and ratings on complexity and uncertainty. So this plot shows the aggregate complexity/uncertainty value of those 100 topics by subject area of the topic. You can see it all in much more detail in the notebook I link to in my comment.
ChatGPT is not a data source, even for data about itself. There is no underlying "thinking machine" that can, say, meaningfully assign numeric scores like this. It is essentially a statistical language machine. It is a very impressive parrot.
There is nothing inside of it that can autonomously reach a conclusion that a topic is too difficult to comment on; in fact, many people have noted that it will generate text that sounds very confident and is very wrong. It does not have a "mental model" by which it can actually be uncertain about claims in the way that a human can.
The first question you asked (100 topics) is perhaps one that it can answer in a meaningful way, but only inasmuch as it reveals things that the programmers programmed it not to talk about. But the others reflect only, at best, how complex people have said a topic is, in the corpus of text that was used to train its language model.
Regarding the plot itself, I would suggest "uncertainty about topic" and "complexity of topic" for the labels, as the single-word labels were difficult for me to make sense of. I would also suggest reordering the labels, since complexity should be the thing that leads to uncertainty (for a human; for ChatGPT they are essentially unrelated).
A lot of very confident points that you've posted, you'd do well as an online AI.
The fact that people misuse it as a data source is not an excuse for you to knowingly misuse it, doubly so without providing any context to indicate that you know the data is basically bunk. This is fundamentally irresponsible behavior. Consider how your graphic will be interpreted by different audiences:
> Whether it "should" be able to assign meaningful numerical scores to things like this, it sure was willing to.
Yes, so will random.org. Should I make a graphic of that too? Perhaps I could imply that it is sentient.
What would be your hypothesis on the reason the fields like parapsychology are different than say computer science in this context. (Bars are flipped, and large difference)
I think it reflects the inherent biases in the design, training and implementation of the ML algorithms that drive ChatGPT: Science topics are considered "less uncertain but more complex" because its source material, creators and developers believe that, but also it has controls in place to avoid saying controversial things and topics like ghosts, history, art & religion are all much more likely to have controversy and therefore be more "uncertain" to ChatGPT when it comes to giving answers.
[deleted]
[removed]
Sorry if this come across as a stupid question, but how are the scales and the intervals determined?
Not a stupid question, it's using the "nice" scales functionality in D3 scales. because the low end doesn't land on a "nice" value it's hidden (which can be really frustrating sometimes). The chart is generated via a dataviz library I created called Semiotic which uses D3 under the hood for things like this. You can see the chart interactively on the original notebook that I link to in my comment if you want to play with it.
Ahh got it. Thanks for taking the time!
What does uncertainty and complexity mean in this context?
[removed]
Dumbbell Plot or Barbell Plot? Will we ever figure out this, the most critical question in modern data visualization?
[removed]
[removed]
I can’t really tell which correspond to which
harrrrrrjinderrrrr t1_jafvsgn wrote
Interesting! What was the data source you used?