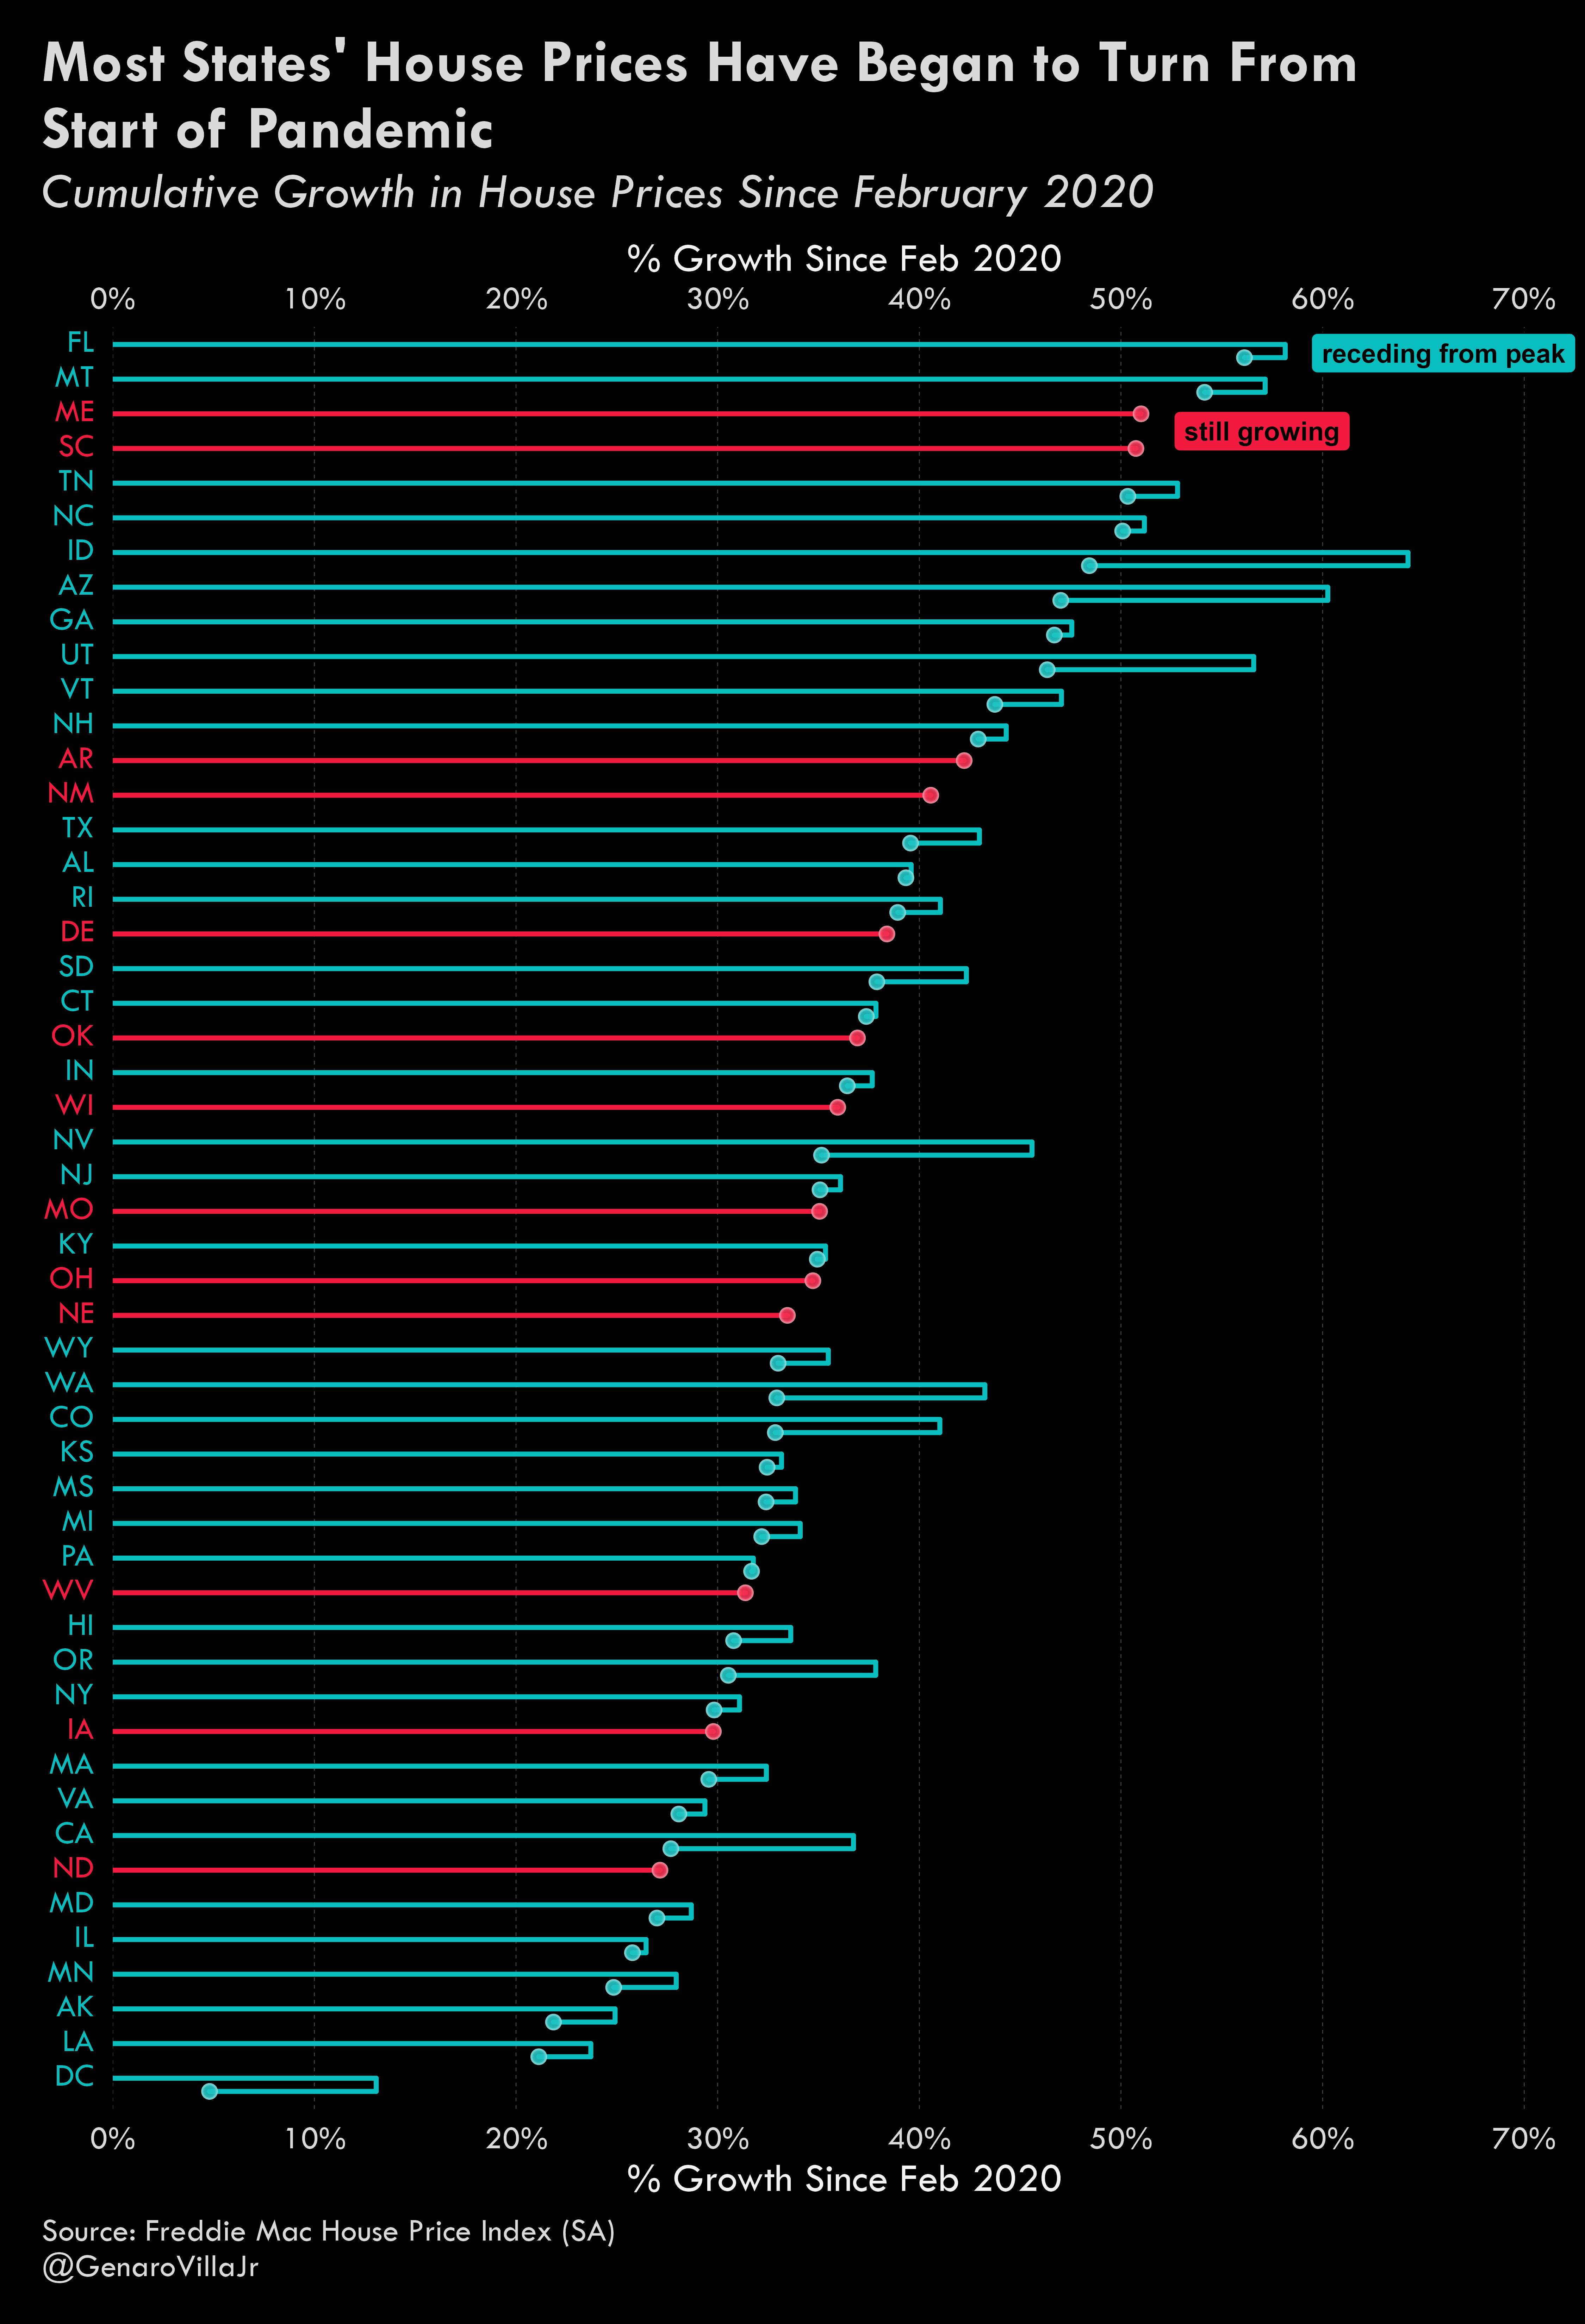
 Cumulative house price growth (February 2020 to January 2023) by state [OC]
Submitted by gvillanomics t3_1273l9k in dataisbeautiful
Logical_Deviation t1_jed8b6i wrote
Incredible graph. What did you use to make it?
gvillanomics OP t1_jed8dsa wrote
Thanks, I used the ggplot2 package in R.
Logical_Deviation t1_jed9sp7 wrote
Woah, I use ggplot2 all the time and I have no idea how you made this
ETA: in retrospect I have some guesses, but just... wow
Flayum t1_jedbikn wrote
Yeah, really well done. Data viz is like black magic sometimes
Viewing a single comment thread. View all comments