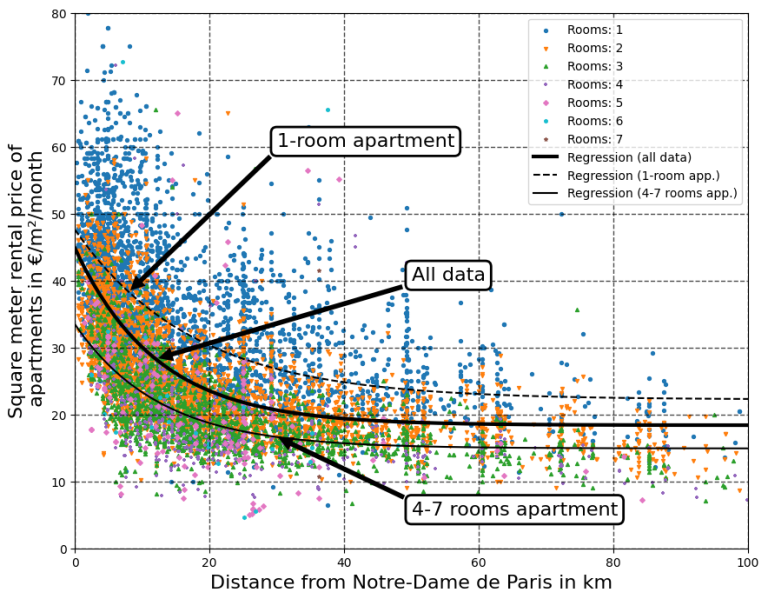
 [OC] Relation between the square meter price of an apartment and distance from Notre Dame de Paris in Paris and Ile-de-France
diffraction-limited t1_jdsez93 wrote
Reply to comment by MarchelloO in [OC] Relation between the square meter price of an apartment and distance from Notre Dame de Paris in Paris and Ile-de-France by sudu1988
It's a visual check if there is still hidden data in your fit. If the residuals seem to be randomly distributed, it's a good first rough check that your model covers all the available data. Usually you find the residuals moving all in one, and then all in the other direction, looks a bit like a wave-y very noisy motion along the x axis.
There are more robust ways to check like Anderson darling if I'm not wrong, but the residuals are easily plotted and a good quick and dirty first check
Viewing a single comment thread. View all comments