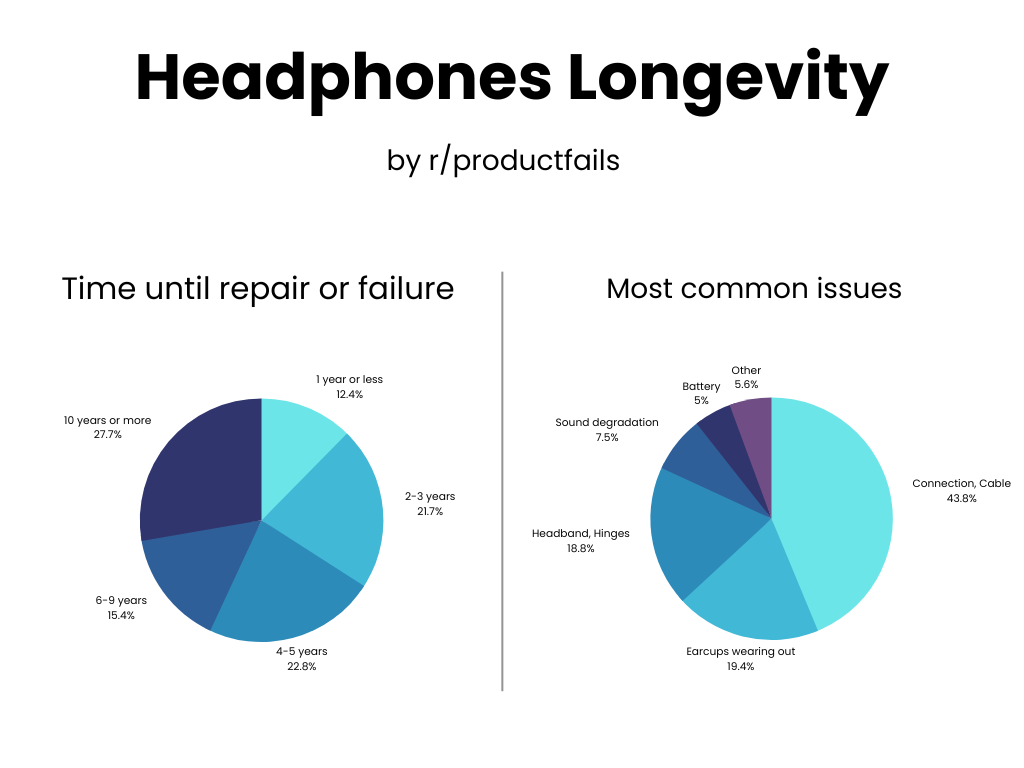
 [OC] How long headphones last and where they fail
Submitted by madredditscientist t3_ymn7rs in dataisbeautiful
underlander t1_iv5mos7 wrote
Reply to comment by madredditscientist in [OC] How long headphones last and where they fail by madredditscientist
tip for folks starting out in data visualization: consider the nature of the variable when deciding how to plot it. Time bins here are rank-order, so they should be plotted in a way that depicts that rank order but also reflects the fact that they’re discrete (not a continuous flow, they’re chopped up). So, a bar chart is most appropriate. Pie charts are for qualitative variables (like separate categories).
Viewing a single comment thread. View all comments