 A plot of the goals scored per game in the 2022 MLS season. [OC]
Submitted by sinfulducking t3_z1ocxi in dataisbeautiful
eric5014 t1_ixc8nj2 wrote
Reply to comment by sinfulducking in A plot of the goals scored per game in the 2022 MLS season. [OC] by sinfulducking
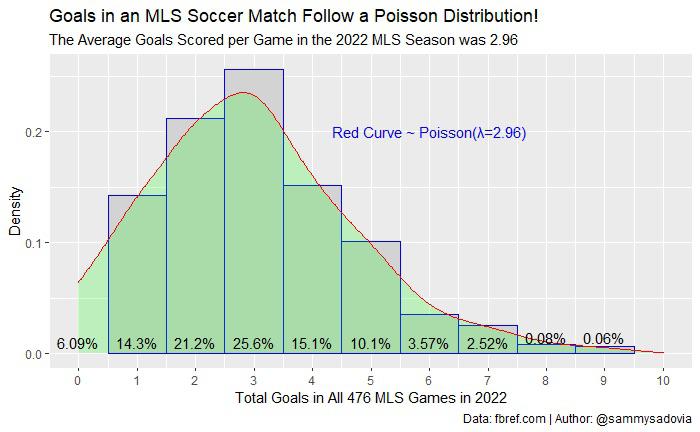
Instead of the curve, red horizontal lines in each column for the Poisson value for each number. That would be more accurate and indicate how close the real values are to it.
The Poisson distribution is exactly what we'd expect if goals were random occurrences and no extra time. So no surprise but a good example for anyone explaining Poisson.
Viewing a single comment thread. View all comments