 [OC] How to spot misleading charts? I would like to hear your opinion on the subject, also any tips design-wise?
dark_o3 OP t1_izgihub wrote
Reply to comment by notkevinjohn in [OC] How to spot misleading charts? I would like to hear your opinion on the subject, also any tips design-wise? by dark_o3
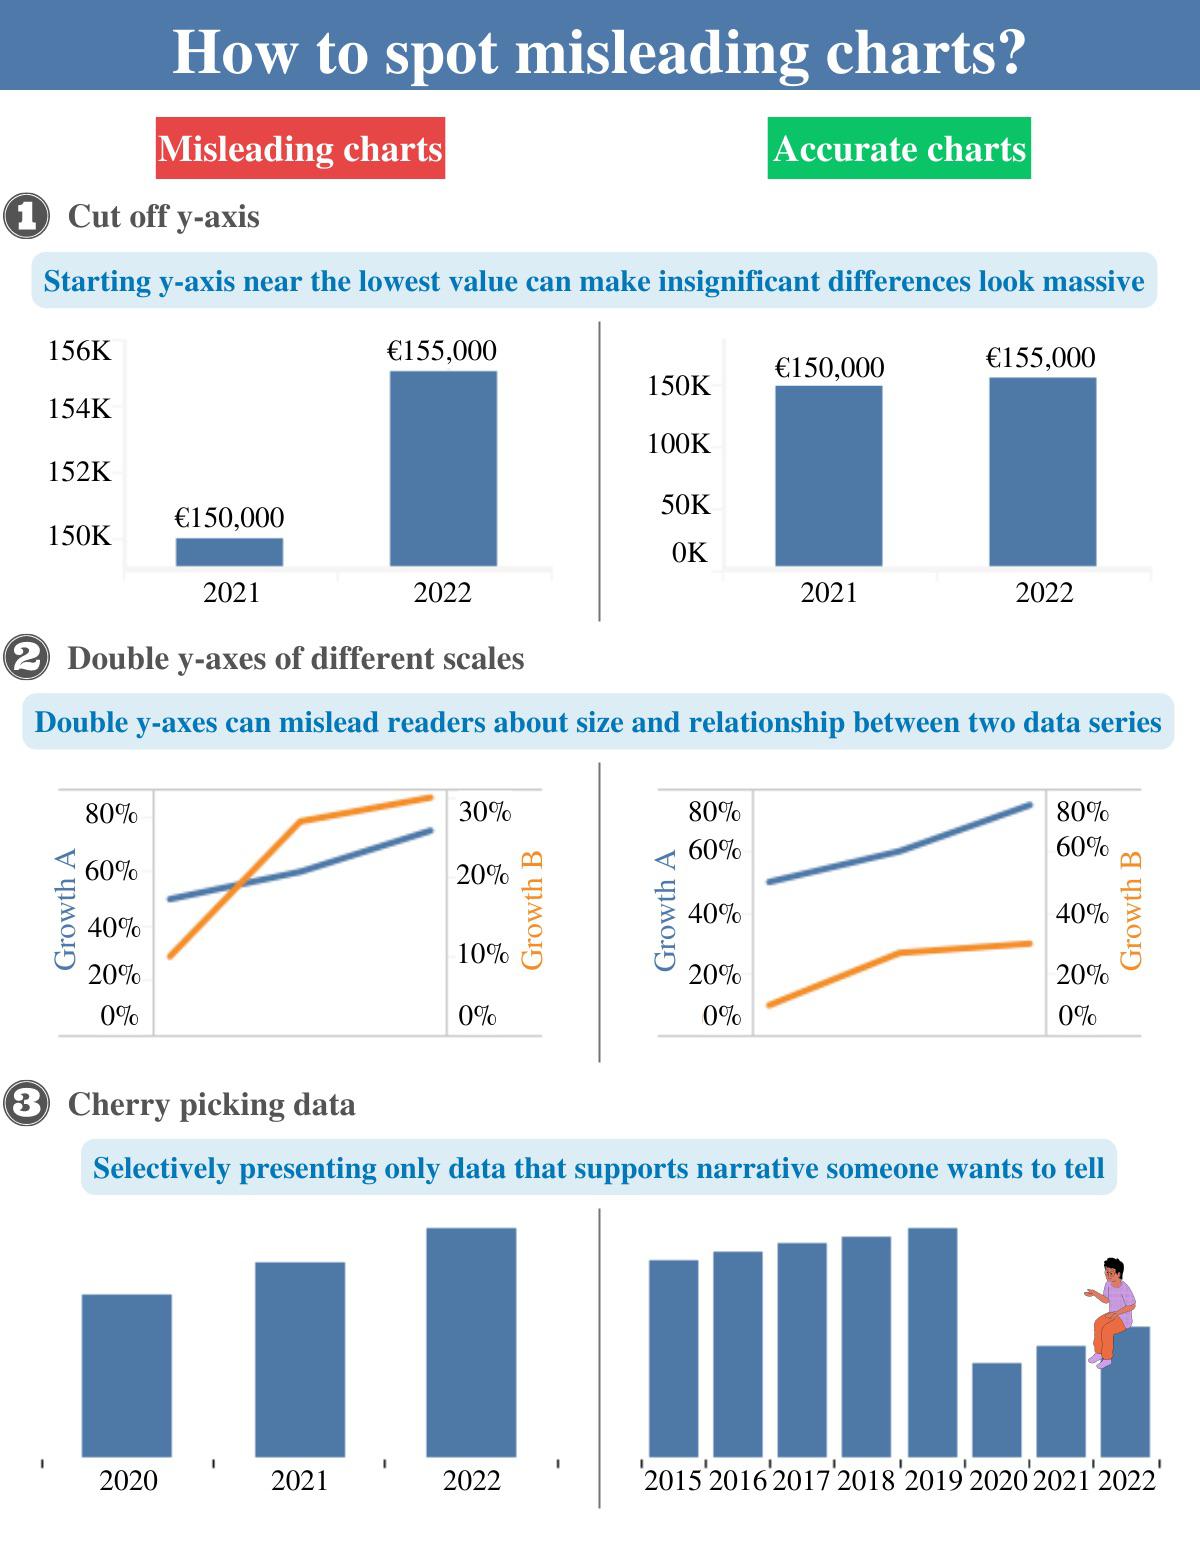
These examples can be used to mislead and the purpose is to show to users how it can be done so the next time users sees truncated bar chart on TV, maybe they will think more carefuly before making judgment about visually represented data.
notkevinjohn t1_izgjs3y wrote
Okay, I said what I came here to say. There is nothing special about the examples you selected. If a user encounters, for instance, a bar chart that's been truncated not to start at zero, it's no more likely that this has been done for legitimate reasons than it is that it's been done for illegitimate ones. Similarly, it's just as likely that a bar chart which begins at zero had it's axis selected to mislead about the data as it is that is has it starting at zero to accurately represent the data. Flagging one of those options as potentially misleading is itself a potentially misleading statement.
If you feel like you need to get the last word in here, feel free. I think I've presented the best form of my argument so I am done now.
notkevinjohn t1_izgkk4r wrote
Actually, I will try and add one more thing to present more constructive criticism:
If you included an example of data being misrepresented by both options, I think you would solve the issue of misleading people into thinking certain plotting practices are intrinsically misleading. So, for instance, if you showed that data can be distorted by truncating a bar graph, but also that data can be distorted by NOT truncating a bar graph, I think you would make a far more valid argument about how to analyze graphical data skeptically.
Viewing a single comment thread. View all comments