 [OC] How to spot misleading charts? I would like to hear your opinion on the subject, also any tips design-wise?
ellWatully t1_izj0kk4 wrote
Reply to comment by MeltBanana in [OC] How to spot misleading charts? I would like to hear your opinion on the subject, also any tips design-wise? by dark_o3
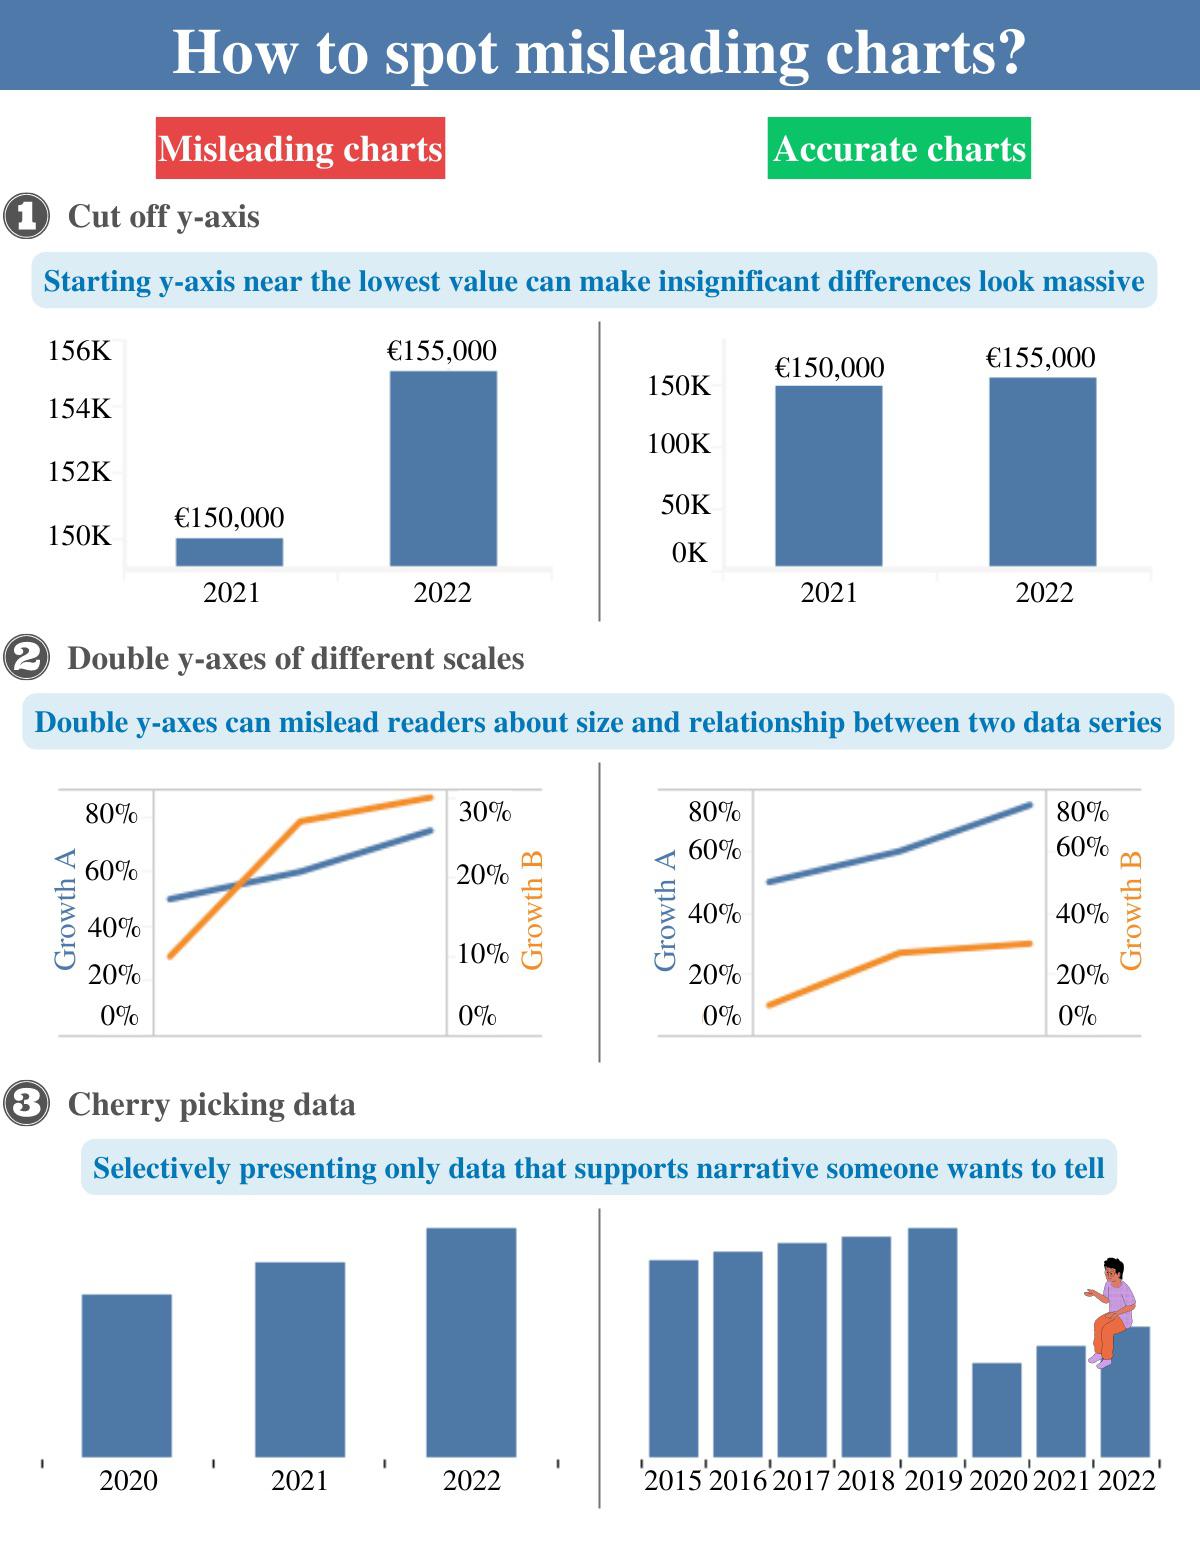
I was thinking the same thing. Having two y axis scales left and right is only misleading if the two sets of data are displaying the same information for different groups. If they're displaying two different attributes of a system, different axes are often the only way to make the plot useful.
Viewing a single comment thread. View all comments