 US CPI reports with corrected time scales. It's helpful to see how out of date the reported numbers are. [OC]
gatogetaway OP t1_j0chvzz wrote
Reply to comment by cheapdad in US CPI reports with corrected time scales. It's helpful to see how out of date the reported numbers are. [OC] by gatogetaway
>A general audience would probably find this confusing without additional explanation.
Agreed. Fortunately, the audience here tends to be more chart savvy.
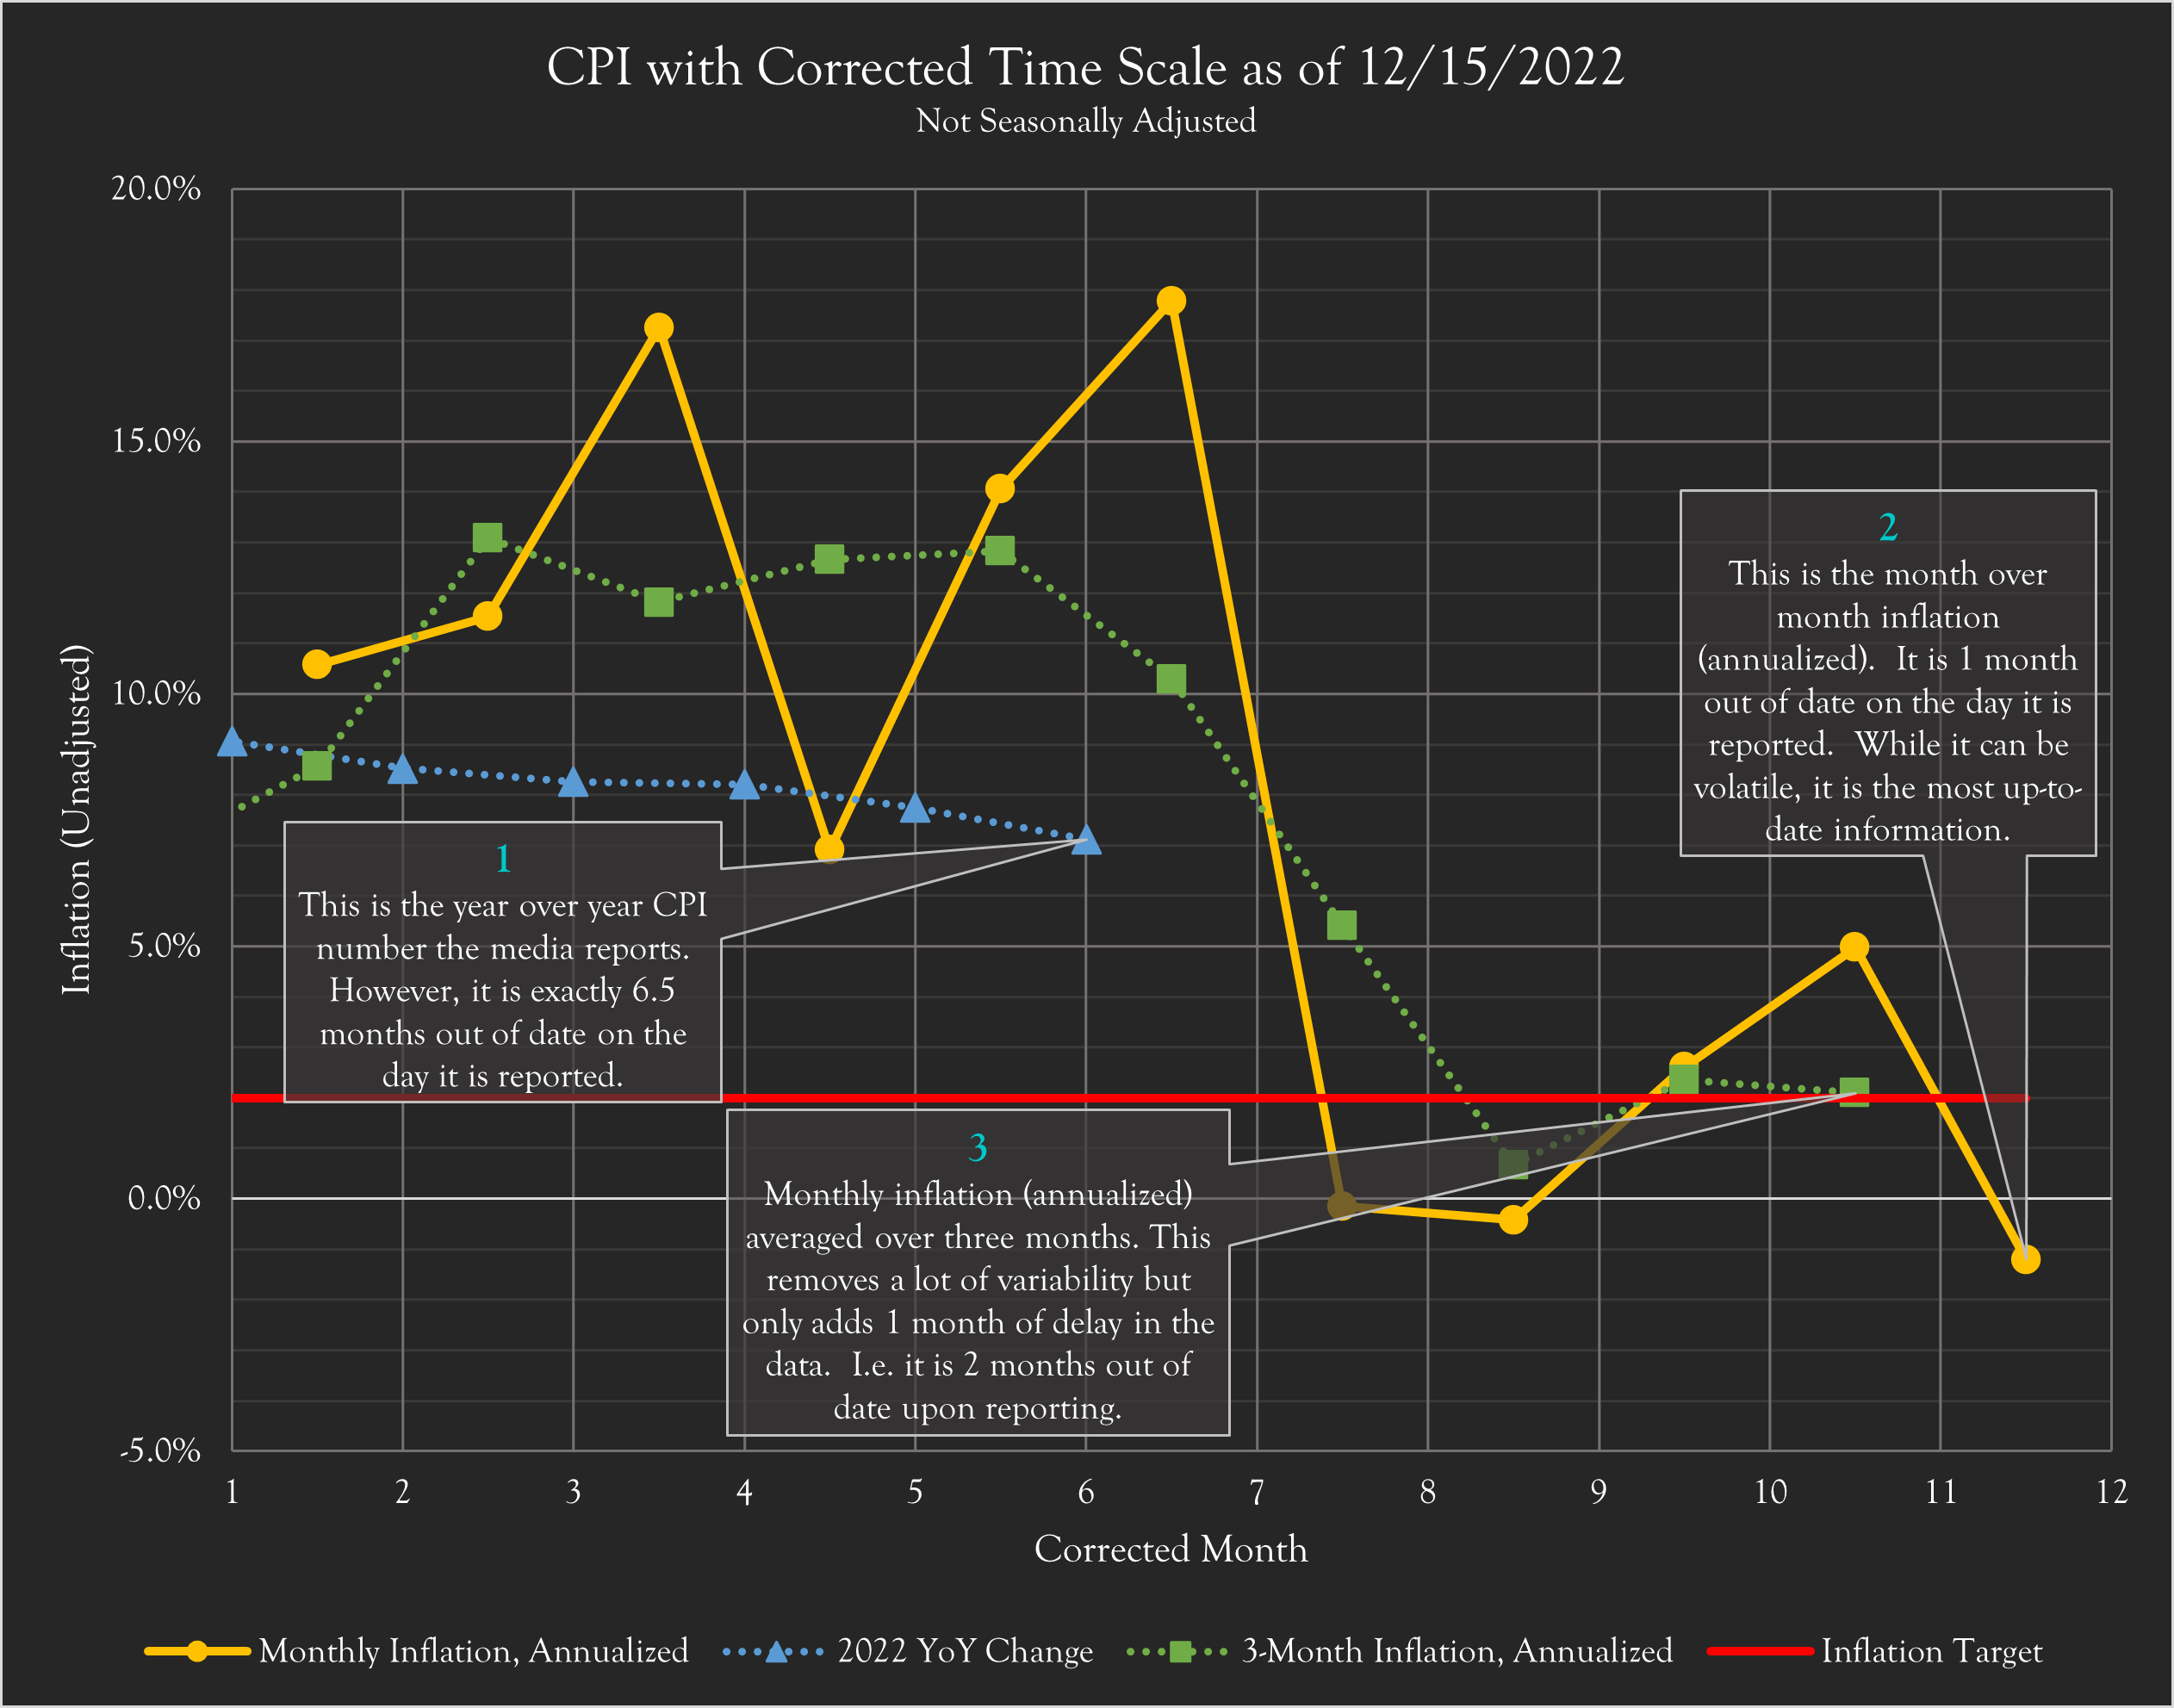
The YOY CPI change for November (centered on 11/15) is reported around 12/15, so that introduces 1 month of delay right off the bat.
A YOY change is also an average of the 12 most recent monthly inflation numbers (actually averaging log(1+MonthlyInflation) and annualizing it is more accurate). Regardless, an N-sample average introduces a signal delay of (N-1)/2.
In the case of YOY, the delay is 11/2, or 5.5. Add on the 1 month of delay in the reporting and you have 6.5 months. So, the number reported on 12/15 actually represents the inflation on 6/1.
tyen0 t1_j0ee6gl wrote
I don't see how a moving average is half of the timeframe out of date. It's certainly influenced by the most recent month, too.
gatogetaway OP t1_j0ewdep wrote
It is delayed by the (N-1)/2 timeframe. But you're right that it's certainly influenced by the most recent month too.
One way to think of it is it's influenced by all 12 months, and the average age of the data for those 12 months is about 6 months old.
The derivation can be found in Understanding Digital Signal Processing by Richard Lyons. In signal processing, filters similar to moving averages are commonly used, and the delay of that signal can be absolutely critical to the functional design of the system.
tyen0 t1_j0f0f7h wrote
I see what you are saying, I guess it's more of a semantics issue, and just eyeballing the data I think people can get how the moving average is lagging, but "exactly 6.5 months out of date" just seems a bit too harsh of a way of phrasing it.
That aside, I think this is a pretty cool visualization.
gatogetaway OP t1_j0f1ybr wrote
Thank you. Cheers!
Viewing a single comment thread. View all comments