 [OC] Minimal share of votes needed to gain X seat under different electoral systems, Excel.
Submitted by Glif13 t3_10p1cv5 in dataisbeautiful
Sorenroy t1_j6kfuws wrote
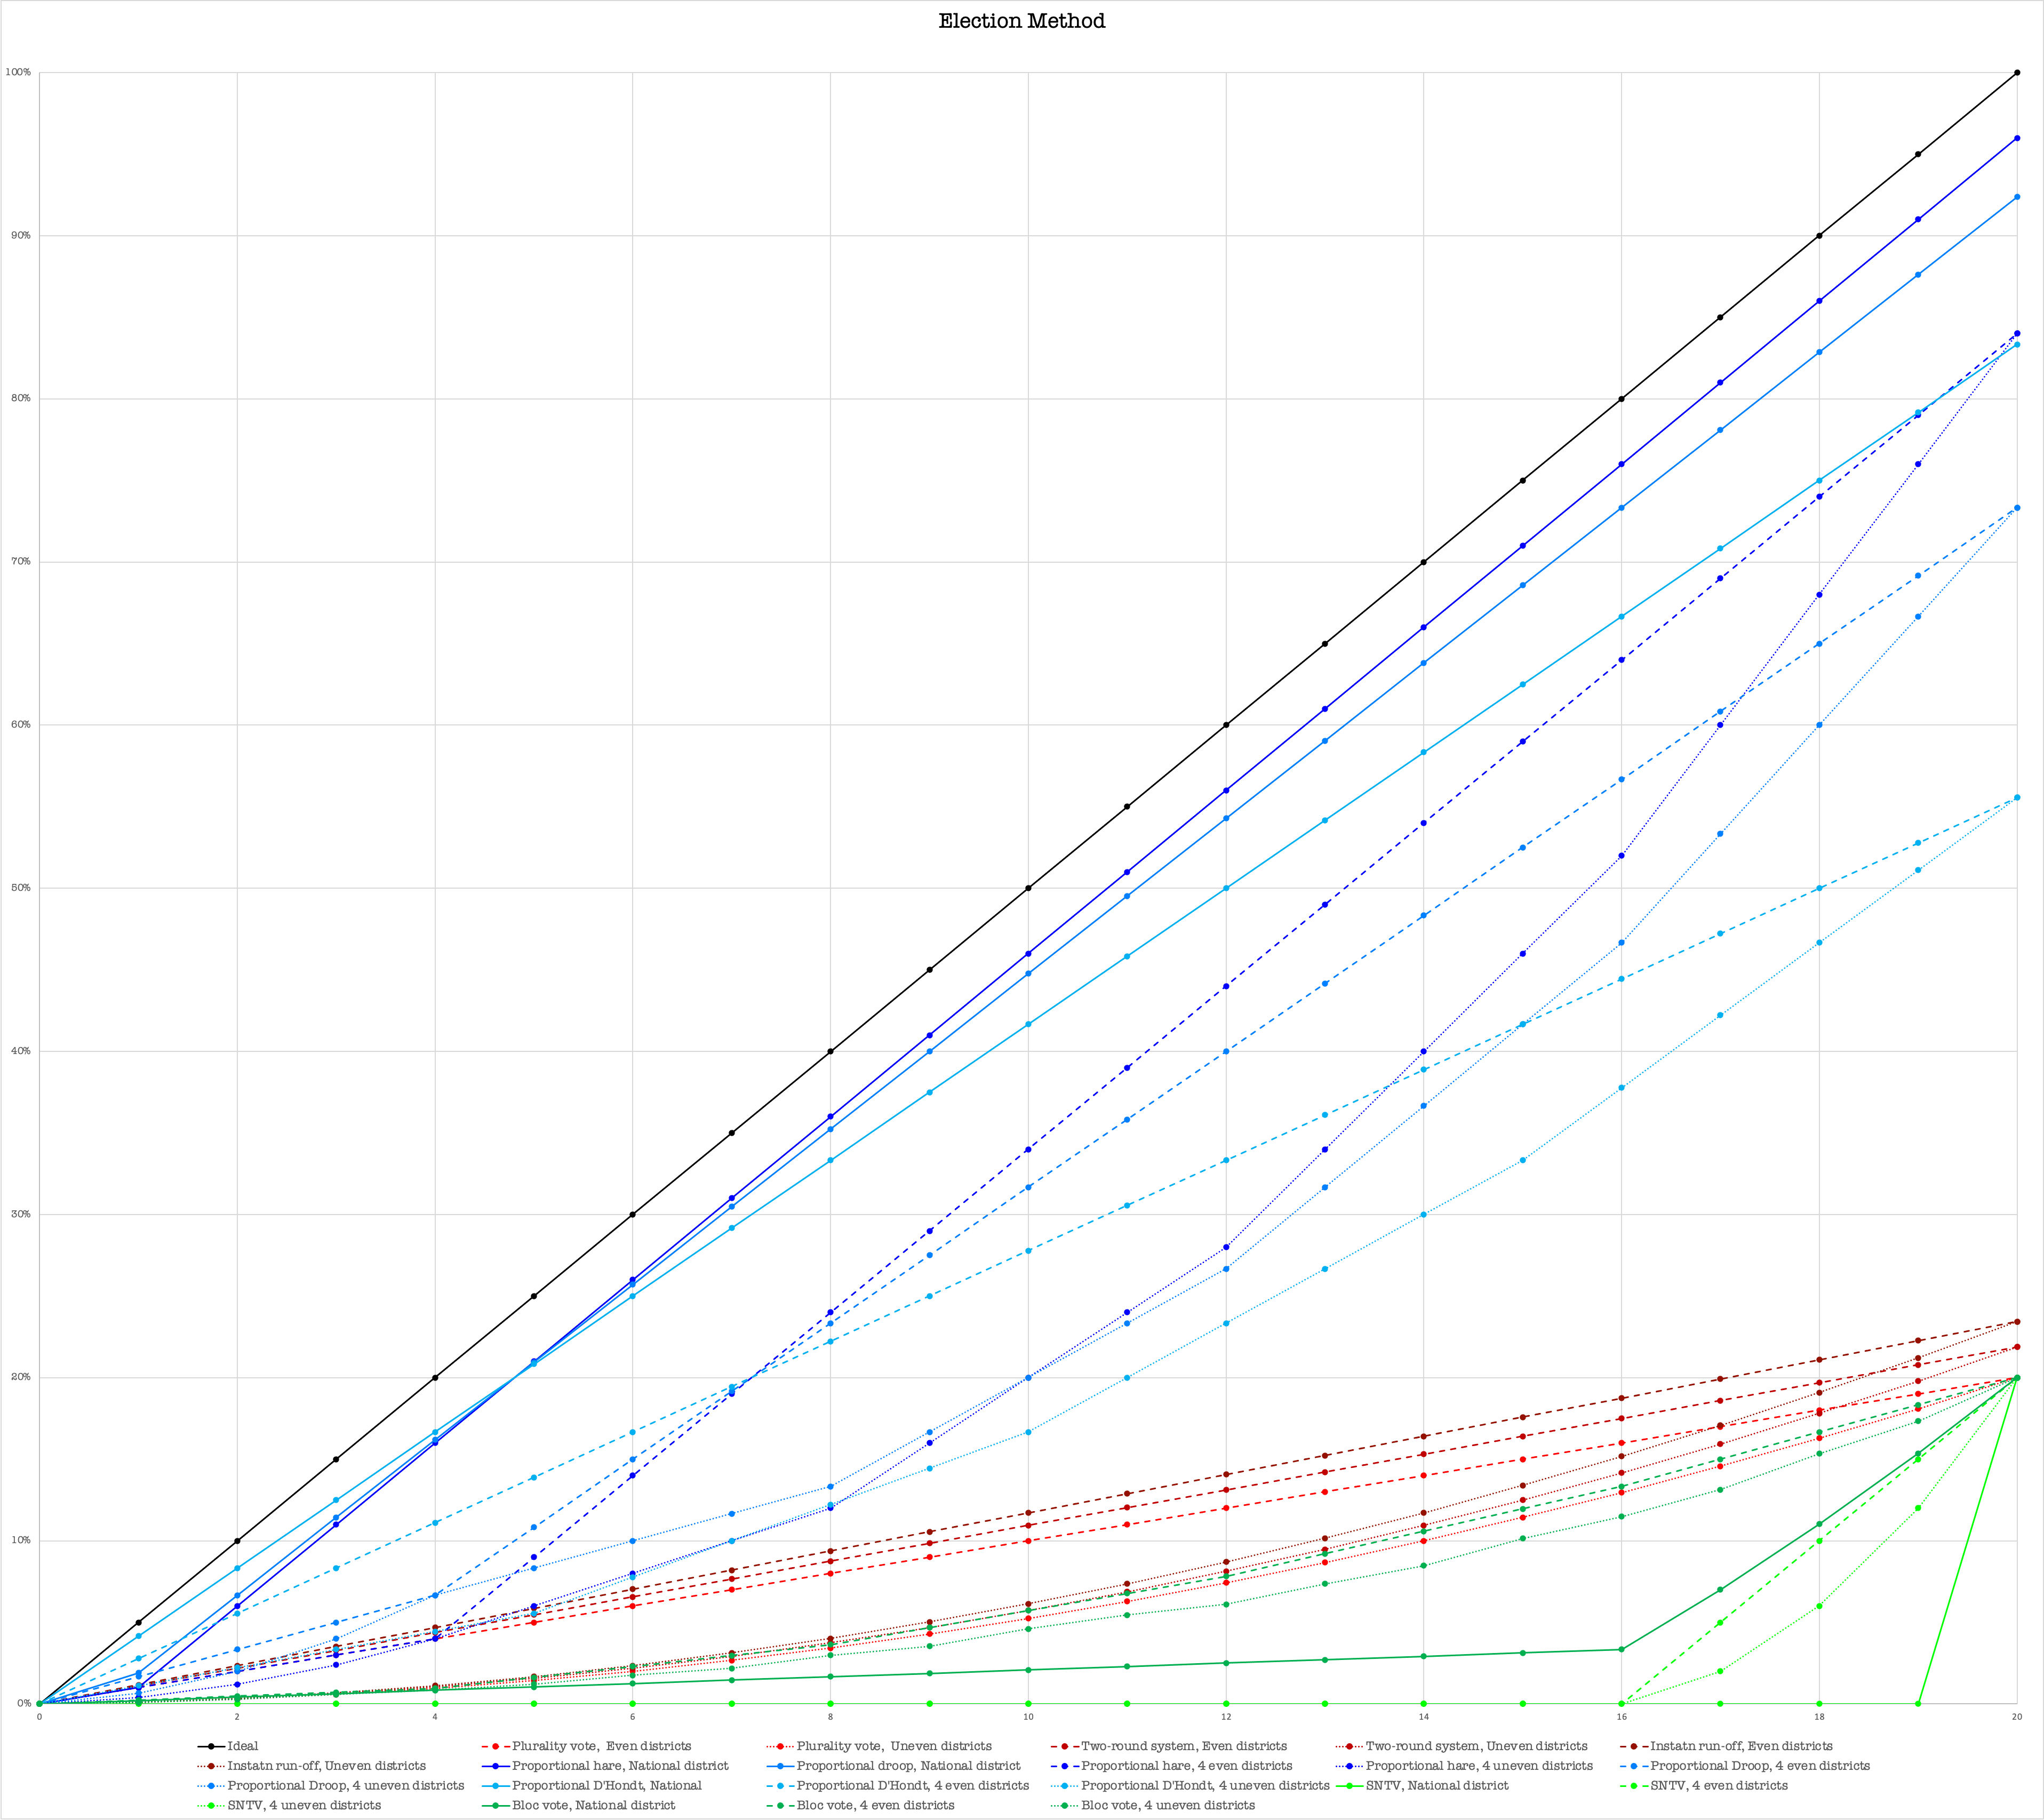
I'd love to engage with the data here, but I'm not sure what the X or Y axes represent given they're missing their labels. I'm assuming that the Y axis is percentage of the vote, but X is more confusing. Is the X axis meant to represent the number of seats won assuming there are 20 seats available?
[deleted] t1_j6nhb5x wrote
[removed]
Viewing a single comment thread. View all comments