 [OC] best-fit lines, correlations: ed spending vs evangelical –– 2020 election
Submitted by terrykrohe t3_10mdxdd in dataisbeautiful
terrykrohe OP t1_j62i7ct wrote
sources
state+local ed spending
https://www.usgovernmentspending.com/compare_state_spending_2019b20a#copypaste
evangelical population
https://www.pewforum.org/religious-landscape-study/religious-tradition/evangelical-protestant/
tool: Mathematica
***************
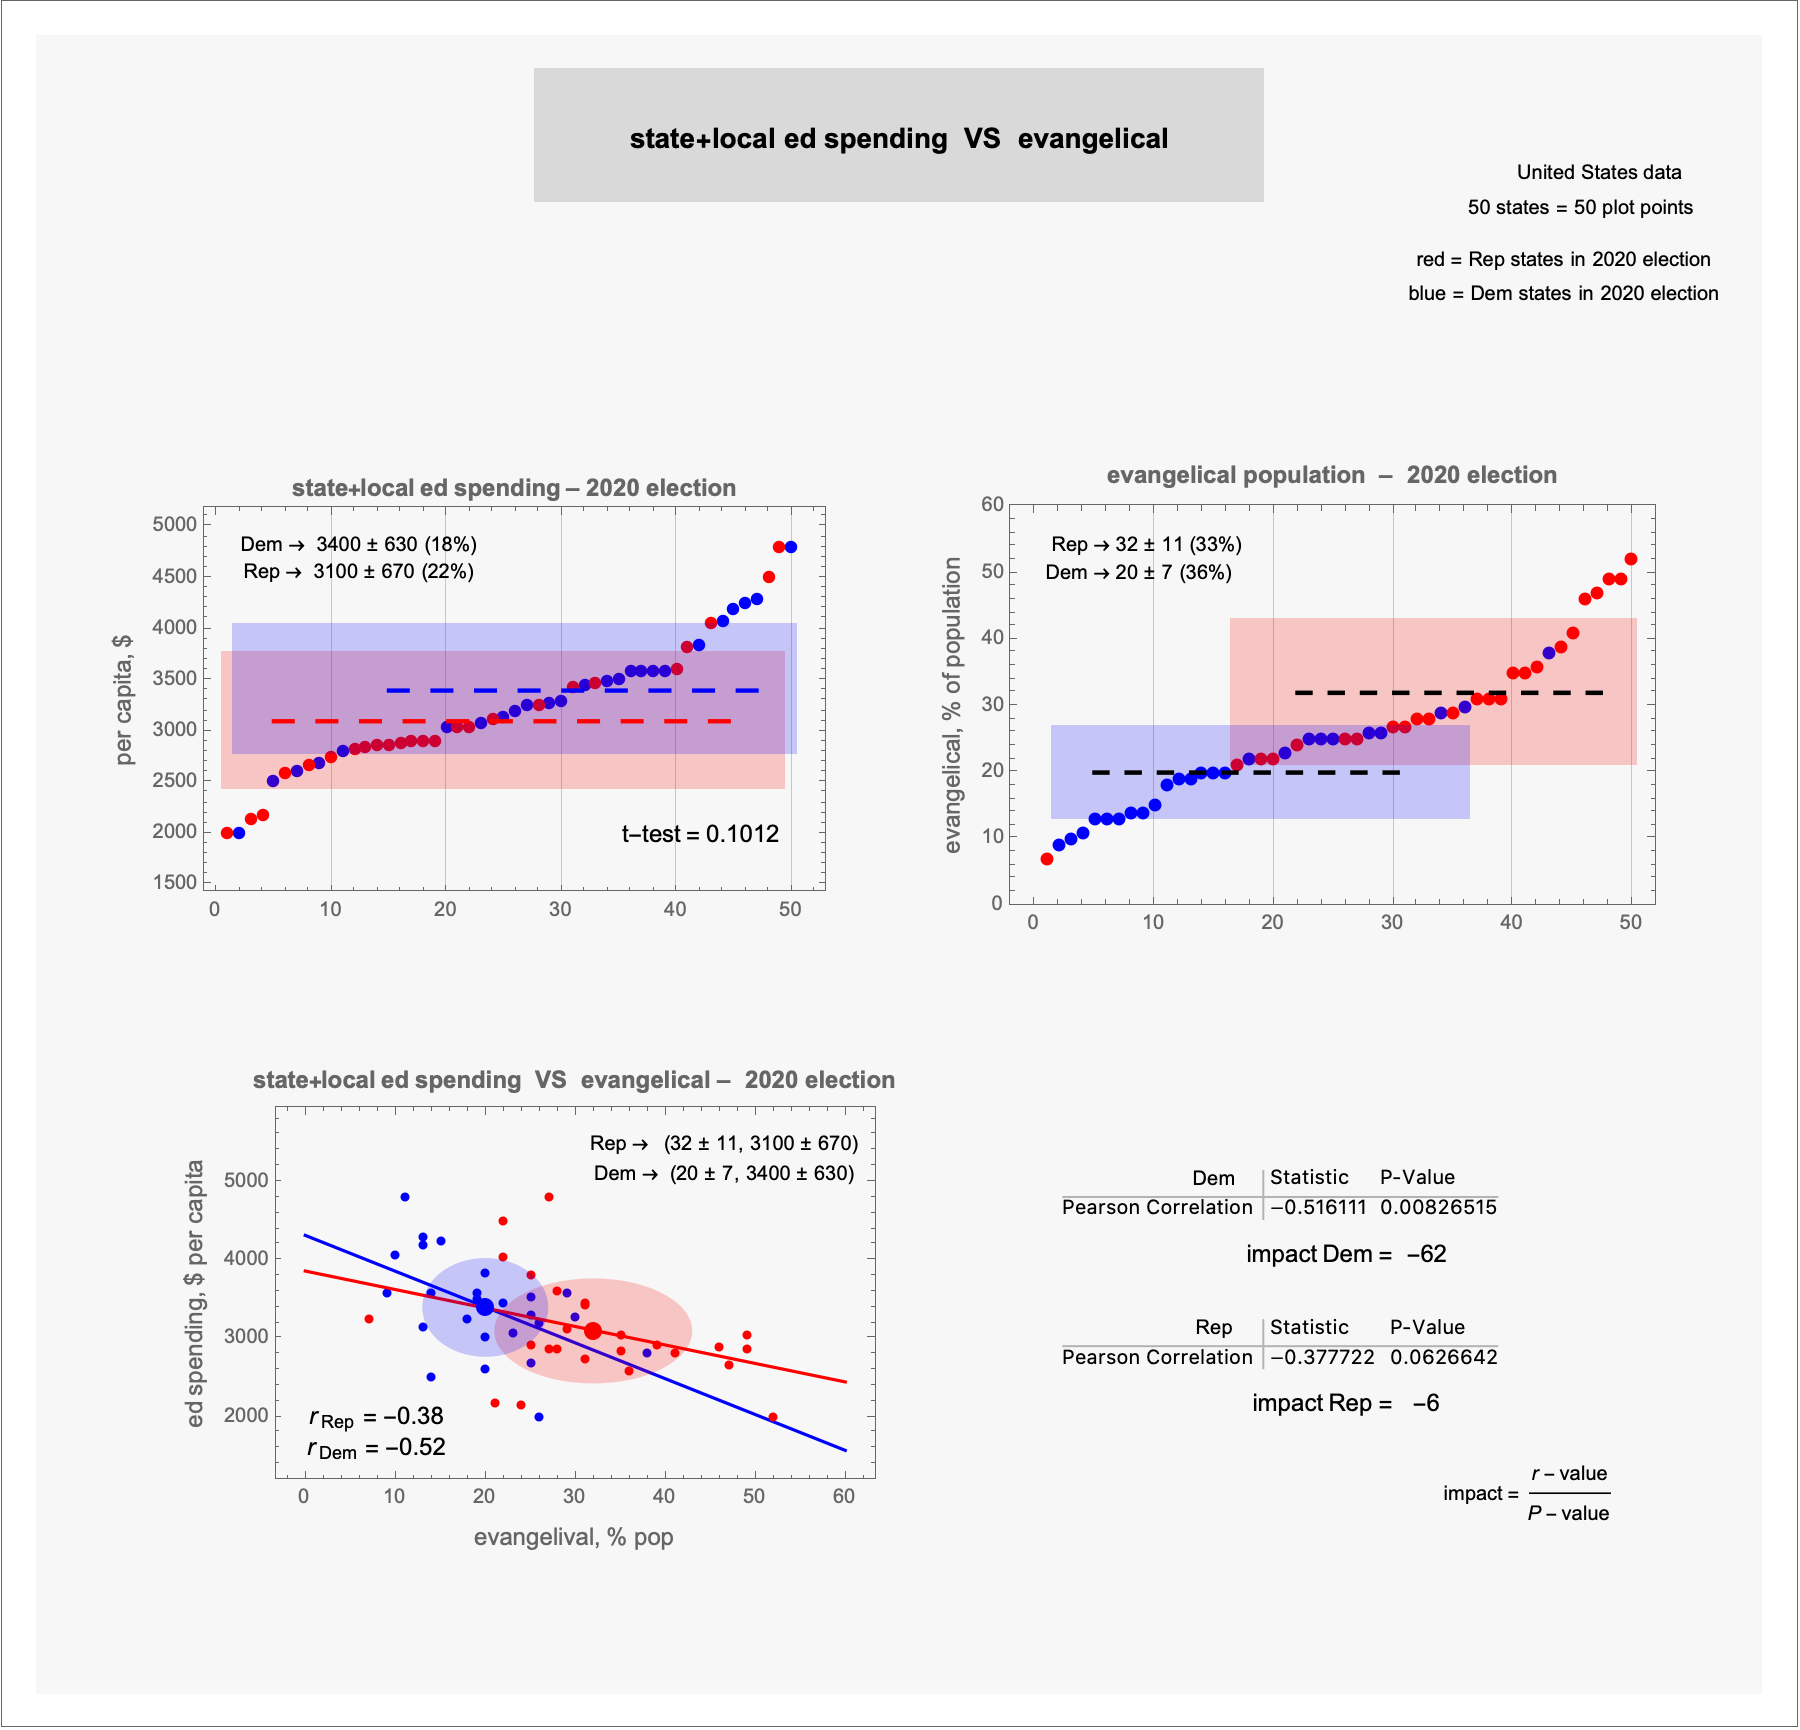
top two plots:
– dashed lines are the mean values; the 'boxes' show one standard deviation from the mean
– "(3400 ± 630 (18%)" represents (mean ± 1 SD (relative SD); "relative SD" = SD/mean
bottom plot:
– the ellipses are centered on the Rep/Dem means; the standard deviations are represented by the ellipses' axes
– the 50 plot points represent the (evangelical, state+local ed spending) coordinates for each state; and are colored according to their 2020 Electoral College vote
– "r" is the Pearson correlation value
– the lines are the 'best-fit' lines thru the Dem and Rep data
Viewing a single comment thread. View all comments