 [OC] heart disease mortality, with GDP and life expectancy –– 2020 election
Submitted by terrykrohe t3_10go1zc in dataisbeautiful
Miguel7501 t1_j53wx1r wrote
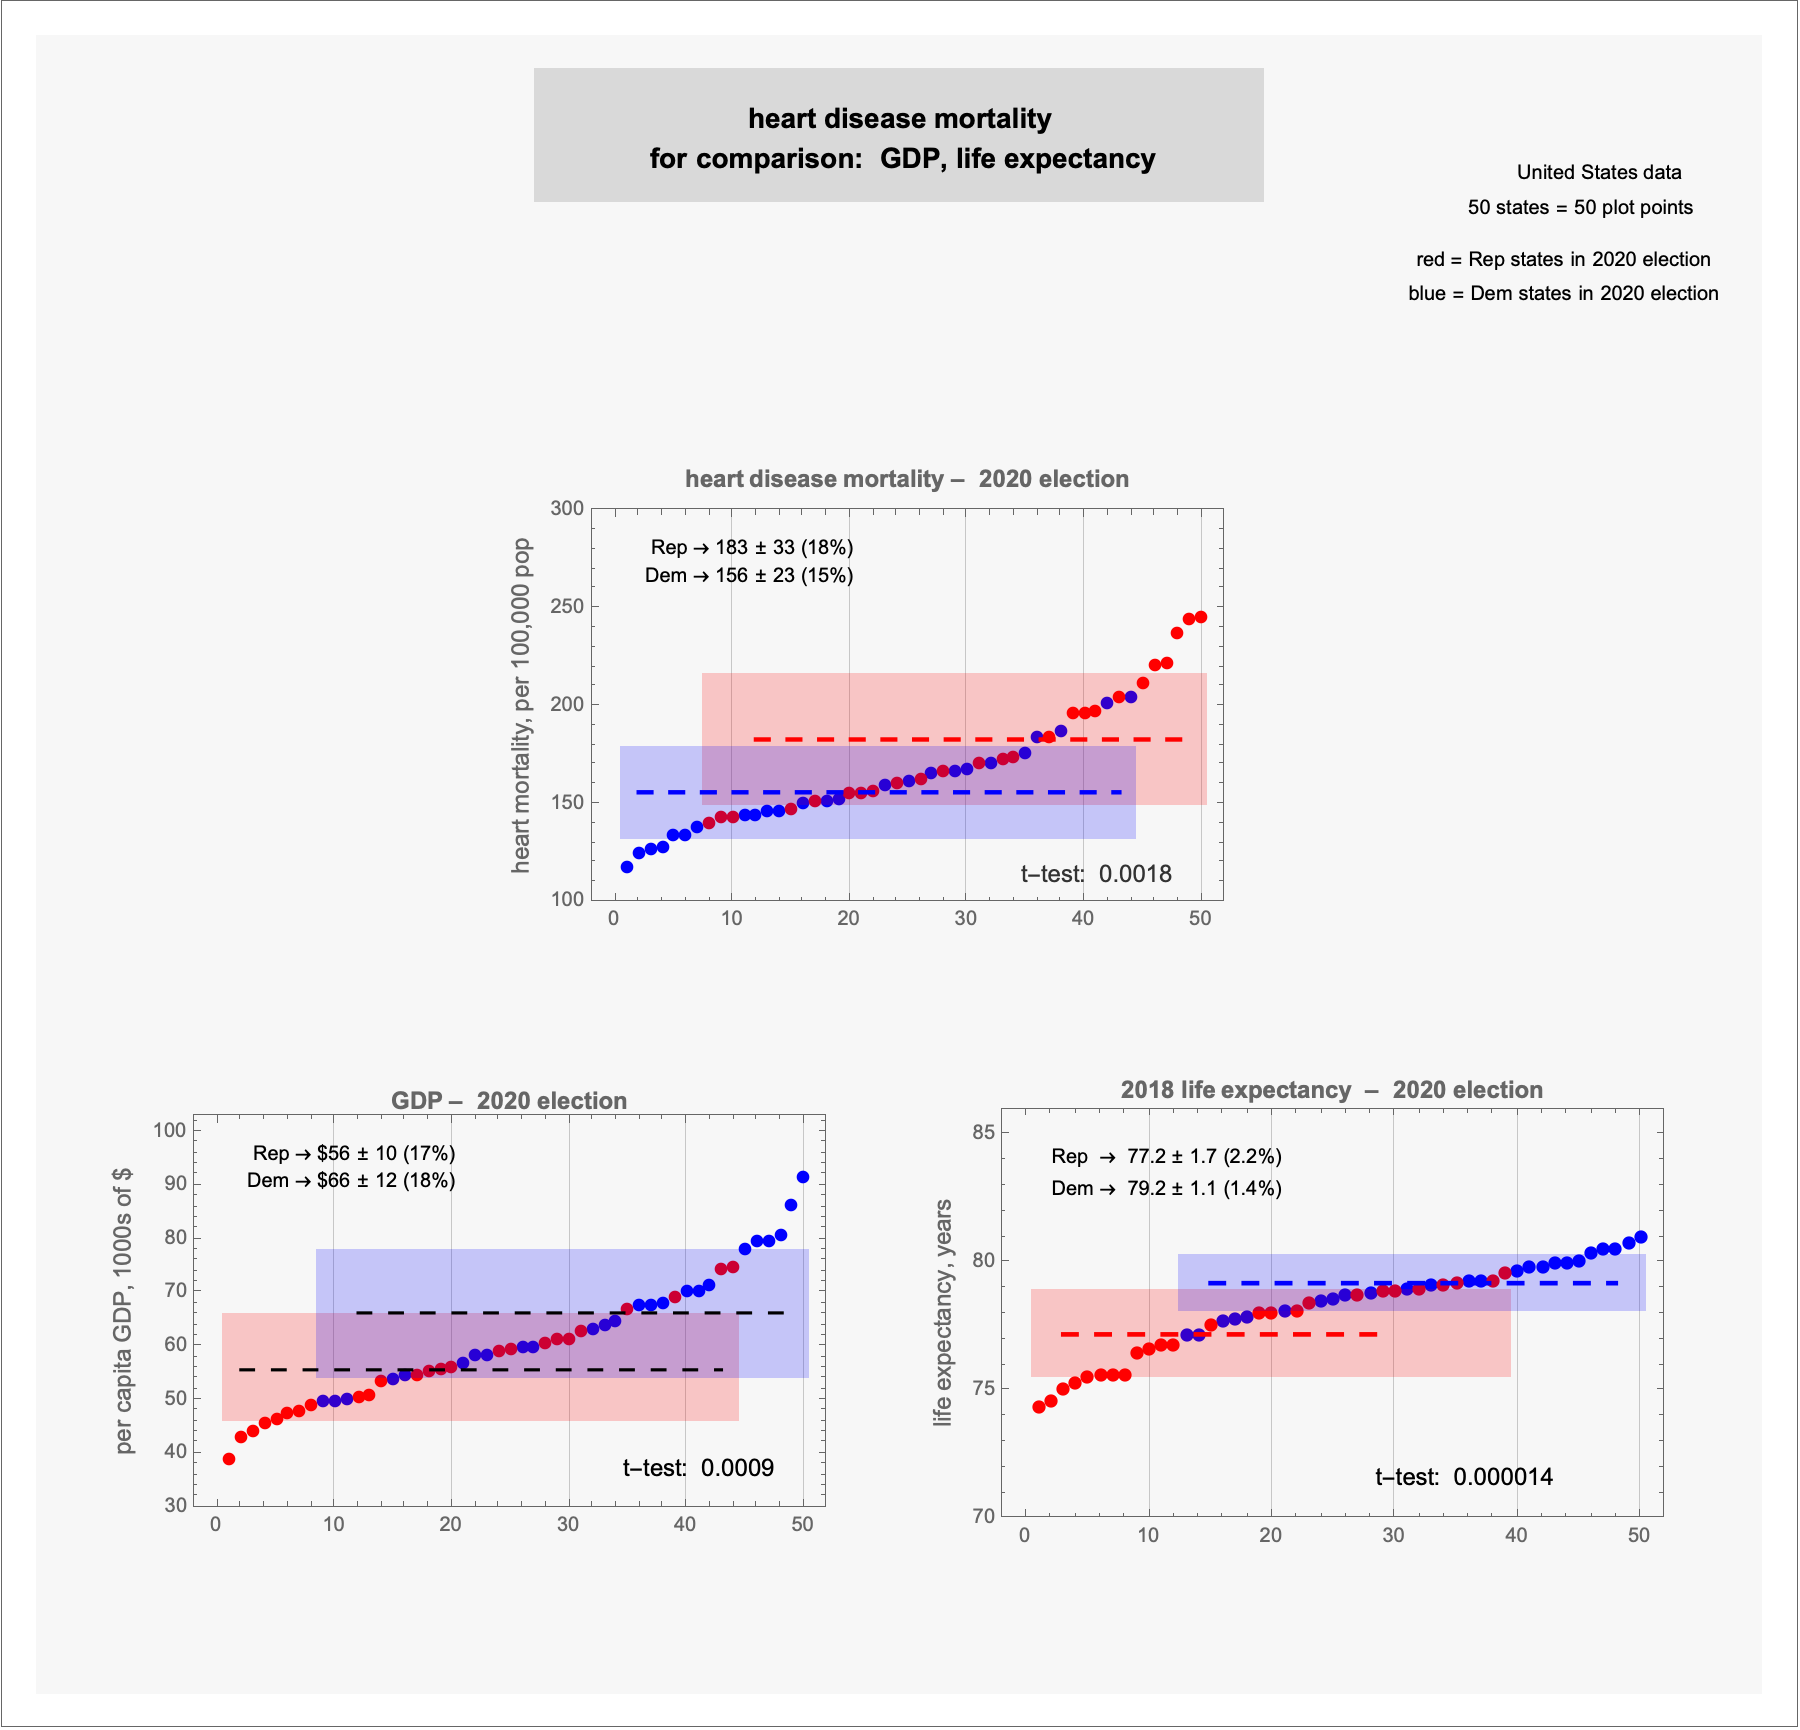
What's the x axis in any of those? Labeling it would help a lot.
terrykrohe OP t1_j549vqt wrote
"50 states = 50 plot points
tables are ofter presented in "rank order": the plot is a visualization of the source's tabular information
Viewing a single comment thread. View all comments