 Books I read in 2022 [OC]
Submitted by cremepat t3_10jbz3g in dataisbeautiful
cremepat OP t1_j5law6s wrote
Reply to comment by coffeesharkpie in Books I read in 2022 [OC] by cremepat
I get you, I was cautious about this viz for that exact reason. I do love looking at data art, but some of it really doesn't resonate with me because I can't understand what point is being made (and as a data journo that's my whole job lol)
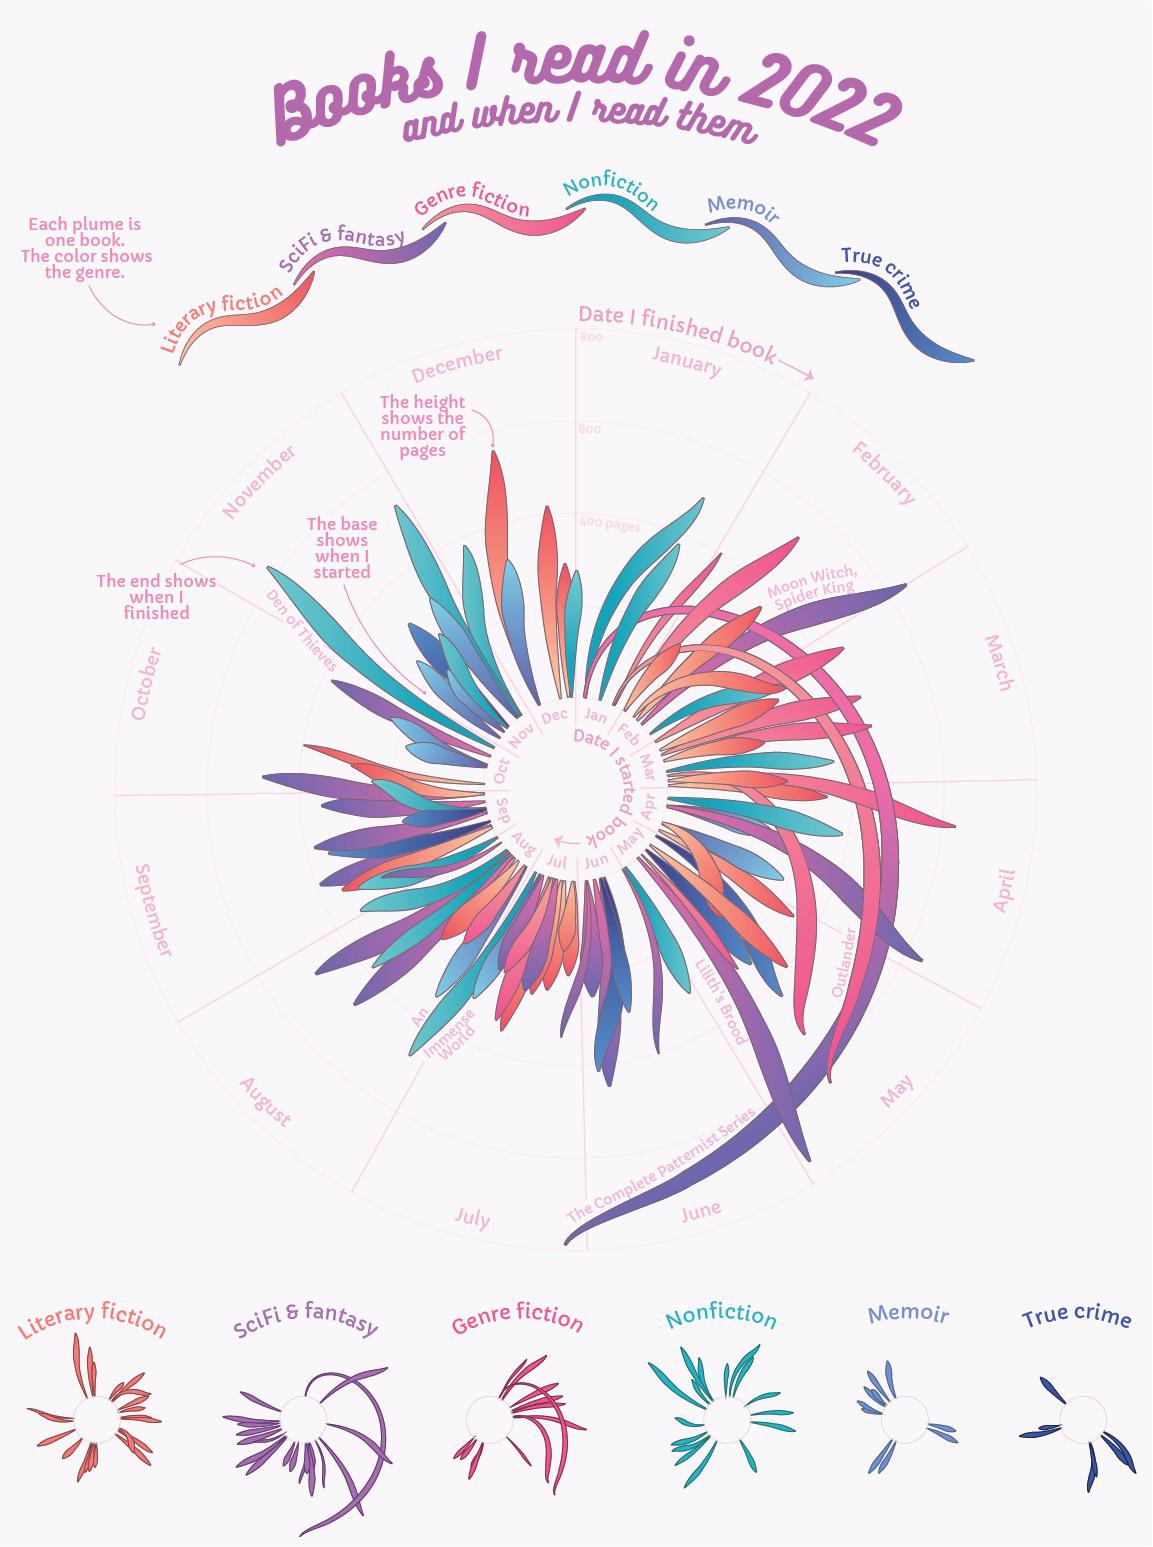
I've done this exact analysis three years running and was getting bored of the same old traditional-ish visuals I'd been doing. I wanted to do something completely different to re-engage myself in the creative process.
I fiddled with a lot of "field of flowers" ideas using geom_bezier in ggplot to make curved "stems" showing the length of the books I read, and layered geom_points to make flowers colored to represent the genres. Everything I worked on in that vein felt like I was ripping off Valentina D'efilippo.
I randomly adding in a coord_polar to my plot and really liked the output. From there, I refined in ggplot (eg removing the flower heads) and gussied it up in Illustrator
coffeesharkpie t1_j5lm7ou wrote
Thanks, appreciate the response
Viewing a single comment thread. View all comments