 Violent Crime Rates of Massachusetts Municipalities (2020) (OC) (re-upload based on constructive criticism)
potkea OP t1_j24qtz5 wrote
This is a re-upload based on the constructive criticism you /r/massachusetts users gave me. The original thread is archived here
I'm from Michigan, I just was teaching myself QGIS and decided that making this map would be interesting.
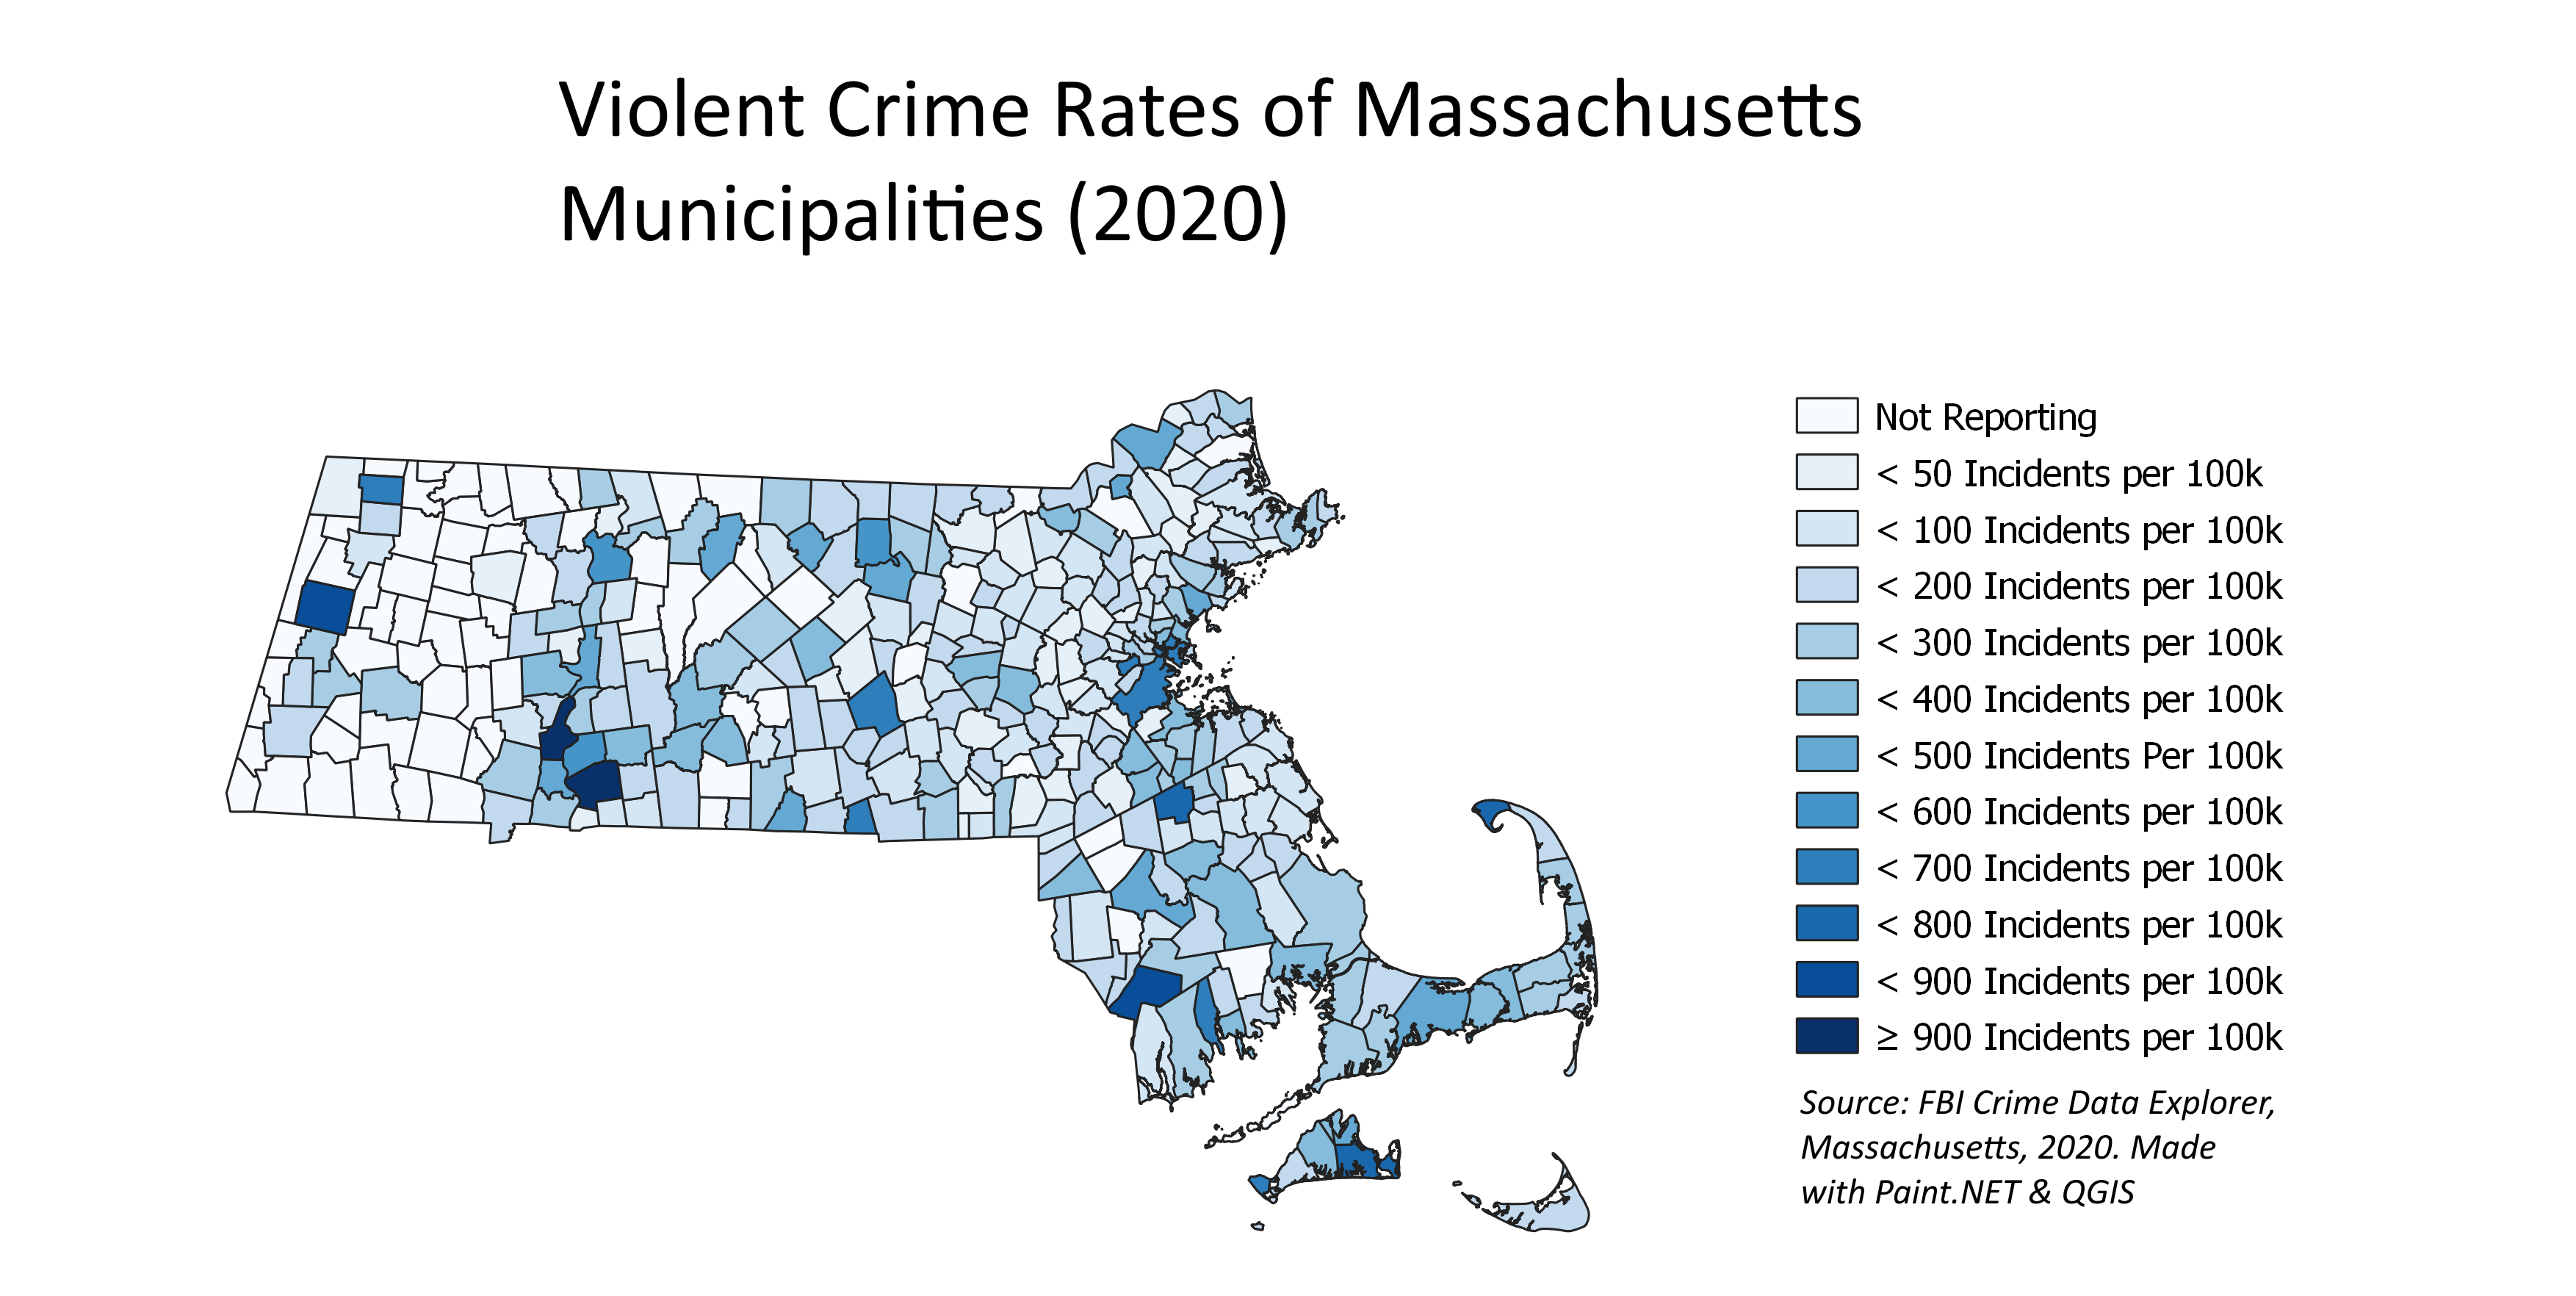
I used the FBI's crime data explorer to gather info on the number of violent crime incidents from reporting municipalities, divide that by the estimated population, and multiply that number by 100,000 to get the violent crime rate. For example: Boston had a total of 4,354 reported violent crimes in 2020 and an estimated population of 697,323, so (4,354/697,323) x 100,000 = a violent crime rate of 624.38 incidents per 100k.
Overall, the Commonwealth had 308.8 incidents of violent crime per every 100k residents, making it the least safe state in New England but safer than many other states and lower than the Nationwide rate of 398.5 incidents per 100k.
And since people were asking about this: Not reporting just means that the data isn't reported to the FBI.
Viewing a single comment thread. View all comments