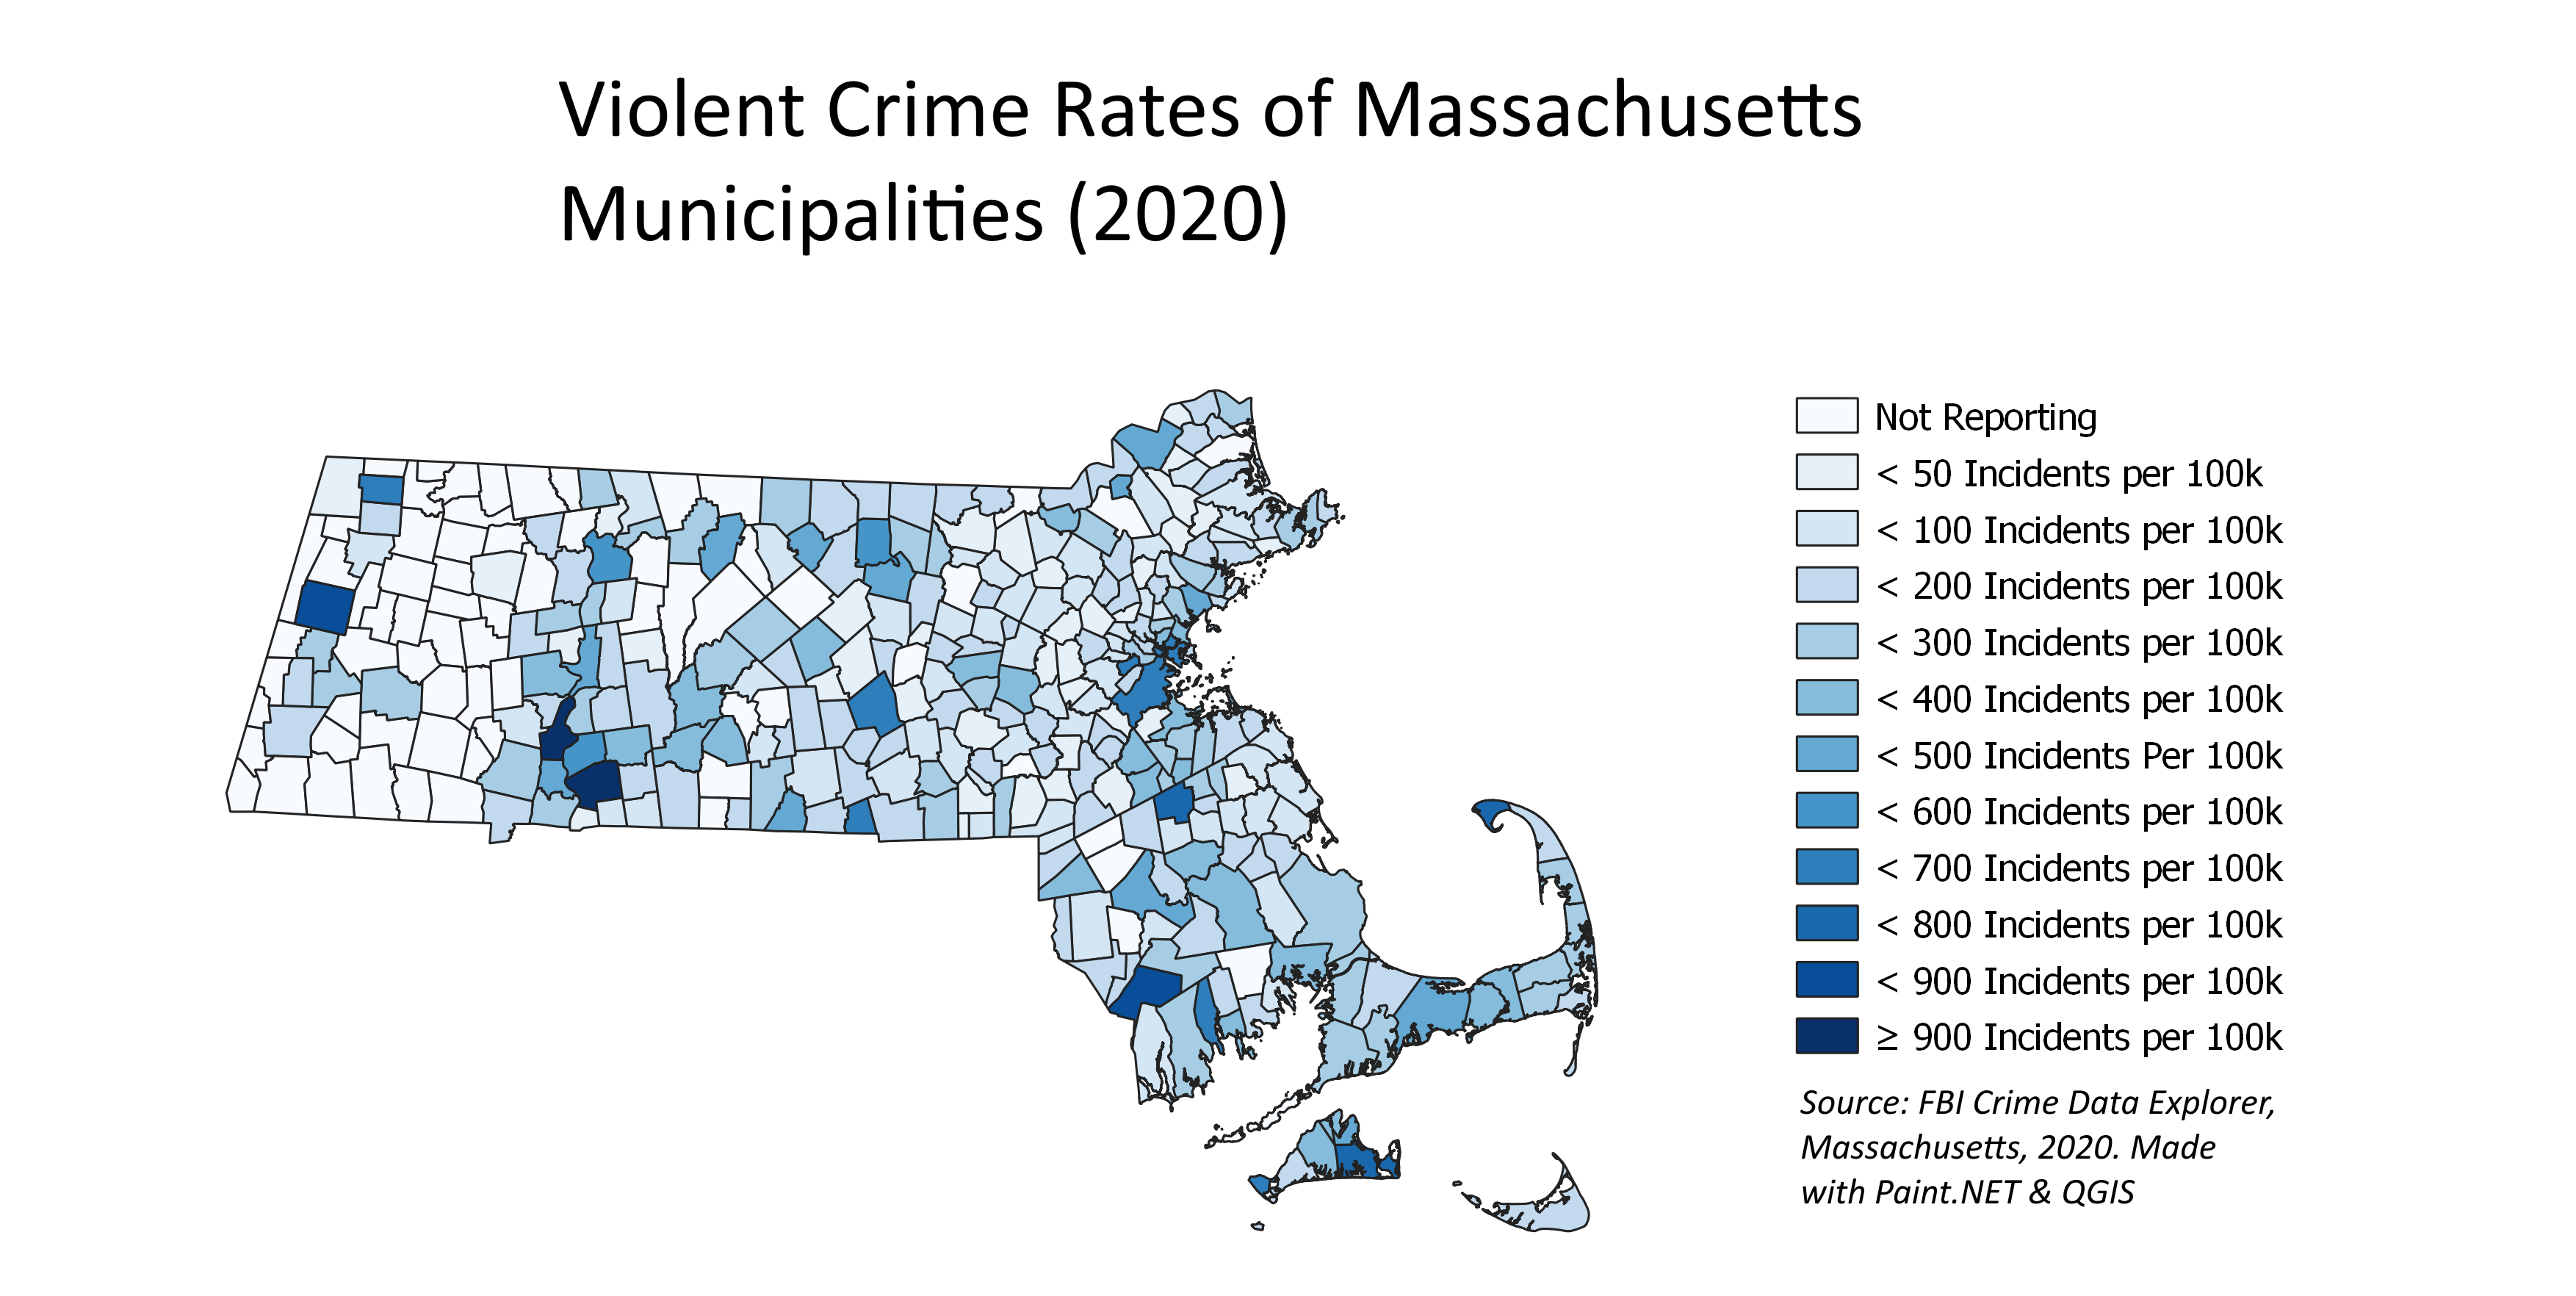
 Violent Crime Rates of Massachusetts Municipalities (2020) (OC) (re-upload based on constructive criticism)
potkea OP t1_j25c8gd wrote
slib9898 t1_j25dz30 wrote
I think there is still a similar issue. not to say these maps you made aren't good. thank you so much for them, OP!
I also have some trouble differentiating. it would look a lot uglier, but maybe making each color entirely different would help, but then you lose the benefit of being able to look at the map as a whole and seeing clusters of counties/ cities with crime
heklakatla t1_j25j85t wrote
/u/potkea - It's the gradient.... There are too many steps with colors that are too similar. If you poke around /r/dataisbeautiful for a period of time you'll see some constructive feedback in and around that area.
potkea OP t1_j25upuj wrote
Ok. Thank you.
DawctorDawgs t1_j26lwaw wrote
Hey potkea! Id potentially make the data into fewer cuts, which would eliminate the number of shades & simplify this overall…maybe 250/500/750/+.
What you’re really drawing attention to is outliers, and they’ll remain as such even with fewer cuts. You can also put the “incidents per 100K” somewhere ONCE - no need for it written out each time. With newfound space (or maybe even without), blow the map up larger, and maybe add a few labels somehow, calling out major cities (small, potentially unnecessary idea tbh), but could be helpful to orient.
Previous_Pension_571 t1_j2a7wt1 wrote
The point of the map isn’t to see and match individual colors it’s to see trends across the state.
tstop22 t1_j265xk4 wrote
Maybe, but I think it’s a combination of things that are confusing my eye:
- There are probably too many different buckets, what happens if you cut the number in half? Do you lose relevant data for your story?
- The legend boxes of color are much bigger than the states that are colored. This makes it really hard to evaluate color density by eye.
- “No data” can’t be white on a chart like this or you are biasing the story. It should probably be a different palette completely (yellow?) if you are being more neutral.
What story you are trying to tell should dictate your choices.
Interesting plot, btw. Love that you are bringing original content to the sub.
Viewing a single comment thread. View all comments