 "No REALLY, we're doing fine" ~ every bank right now
Submitted by JPowsSecretlover t3_127ifsn in wallstreetbets
erickssm t1_jeetpi2 wrote
Reply to comment by 2bits2many in "No REALLY, we're doing fine" ~ every bank right now by JPowsSecretlover
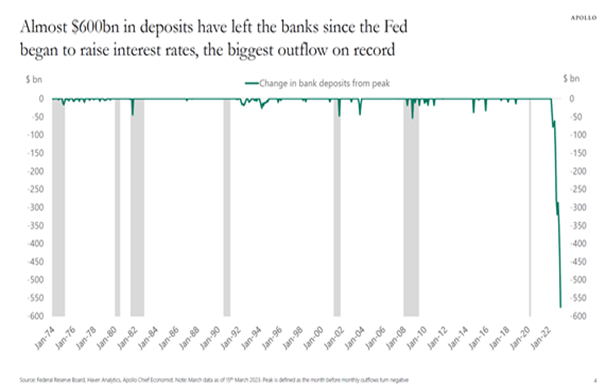
The OPs chart only shows the drawdowns in the data. That chart is designed for shock factor to scare people into thinking that there is something bad happening. The actual data from the FRED site shows the reality. It shows that all of the drawdowns are minuscule in the grand scheme of things. Bank deposits not only have continuously trended higher over time, the current draw down is a fraction of what was moved into deposits over the past couple years.
Viewing a single comment thread. View all comments