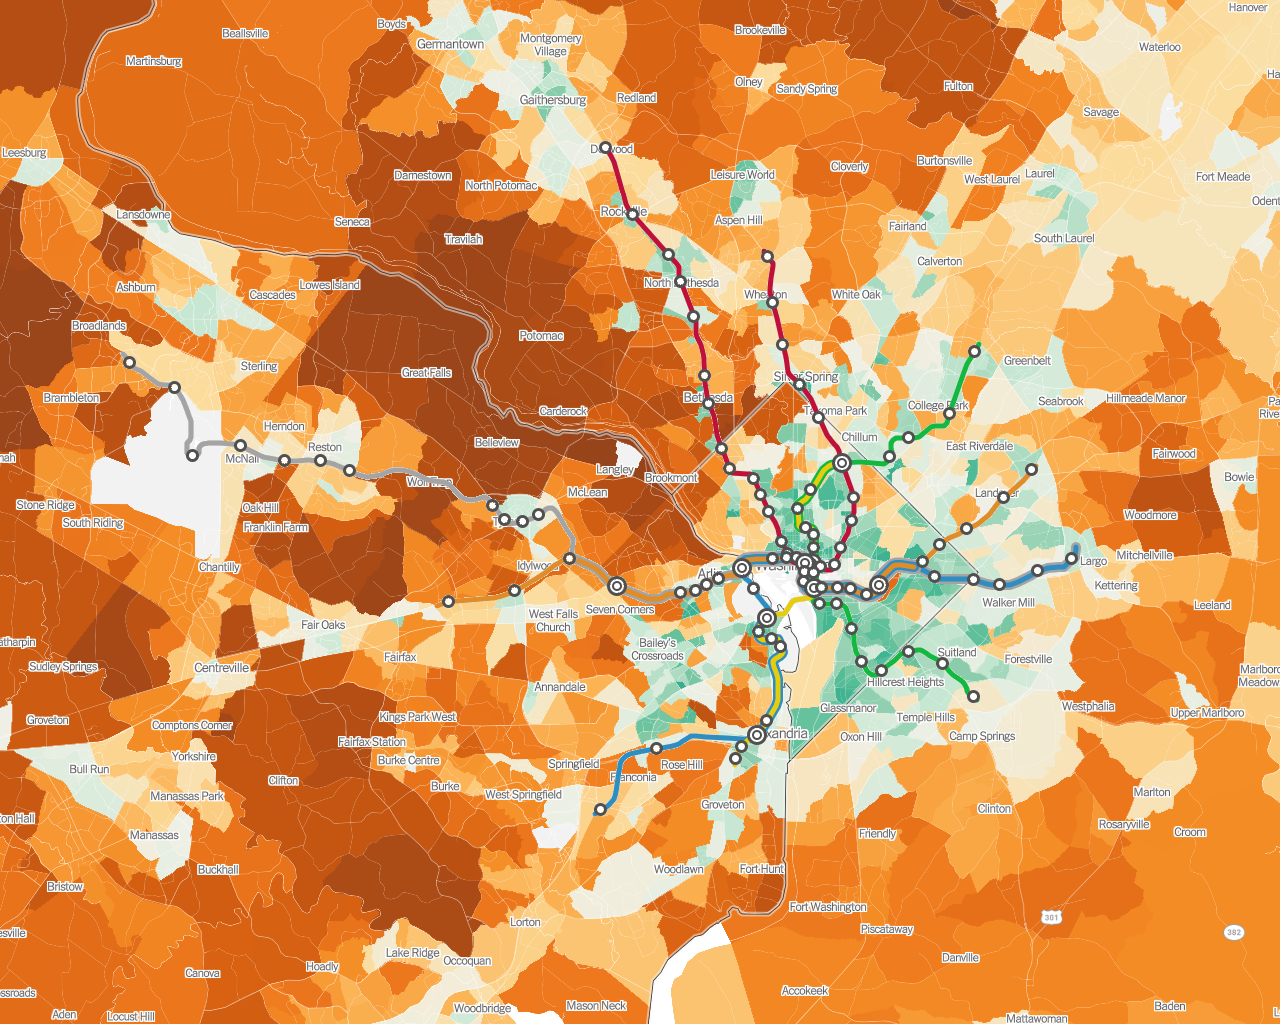
 How transit affects emissions: A map of average household CO2 emissions, with Metrorail routes added
foospork t1_j08r6f7 wrote
Reply to comment by disownedpear in How transit affects emissions: A map of average household CO2 emissions, with Metrorail routes added by Golden_Kumquat
So, Fountainhead Park (on the Fairfax side of the Occoquan reservoir, south of Clifton) has high emissions? There are no homes or businesses there.
I do not understand how the values shown in this map were calculated.
Viewing a single comment thread. View all comments