Birdy_Cephon_Altera
Birdy_Cephon_Altera t1_ja8mdkh wrote
Can't speak for Chase specifically, but our bank sets its CD (and other savings product) rates based on what the competition is offering. They do a survey of all of the banks that are their main competitors in the region every week, and then use that information when setting new rates on various products. If there is some bank that they consider a significant competitor for new-to-bank funds that is offering a higher rate on a certain length term CD, that could explain why that particular product is higher than others.
Submitted by Birdy_Cephon_Altera t3_1137qfe in BuyItForLife
Birdy_Cephon_Altera t1_j8g2ak3 wrote
Reply to [OC] Fast food restaurant chains ranked by average number of visitors per location in 2022 by EvergreenGates
One thing I might be interested in seeing is a plot graph with visits per location on one axis, and number of locations on the other axis. Then some outliers might really stand out - like McDonald's high on both axes, while Church's on the other end of the scale, low on both axes.
Birdy_Cephon_Altera t1_j8g1xpp wrote
Reply to comment by NotTheOnlyGamer in [OC] Fast food restaurant chains ranked by average number of visitors per location in 2022 by EvergreenGates
> Why should I be loyal to a location?
Depends on the fast food place. Some have better management and stricter quality control than others. It's not really much of a problem at In 'n Out or Chick Fil A, where my experience from one location to another I get pretty much the same product and same service. But some other places, like Arby's or Whataburger or Jack in the Box, I have had wildly different levels of quality from one location to the next. Sometimes you can really tell when a good manager and/or owner is in charge of a place.
Birdy_Cephon_Altera t1_j8f0tju wrote
One thing to note, though, is that New Mexico's proved reserves, while second largest of all states (Texas by far and away in first spot), there are only 4.9 billion barrels of proved reserves. At the rate they're pumping, they may tap all known reserves within a decade. This is compared to Venezuela, which is the country with the largest pool of proved reserves at 300 billion barrels - even more than Saudi Arabia. So they have room for continued production for many decades. (Mexico, for comparison, is closer to New Mexico in proved reserves at 5.8 billion barrels)
Birdy_Cephon_Altera OP t1_j025s64 wrote
Reply to comment by Hour_Neighborhood784 in Average Price of Gasoline in the United States, Adjusted for Inflation, 1995 to 2022 [OC] by Birdy_Cephon_Altera
That's the orange line.
Birdy_Cephon_Altera OP t1_j0055g2 wrote
Reply to comment by Neowynd101262 in Average Price of Gasoline in the United States, Adjusted for Inflation, 1995 to 2022 [OC] by Birdy_Cephon_Altera
In this case, because it was just two measures (three if you include the dates), it was easy enough (and quicker) for me to copy-and-paste the data from the source into a spreadsheet. However, the best way to do it would have been to import the data using a query to pull it from the table on the web page, clean it up and load it to a sheet.
Birdy_Cephon_Altera OP t1_izxon3x wrote
Reply to Average Price of Gasoline in the United States, Adjusted for Inflation, 1995 to 2022 [OC] by Birdy_Cephon_Altera
Simple line chart made in Excel, using data from https://www.eia.gov/dnav/pet/PET_PRI_GND_DCUS_NUS_M.htm and https://inflationdata.com/Inflation/Inflation_Rate/Monthly_Inflation.aspx
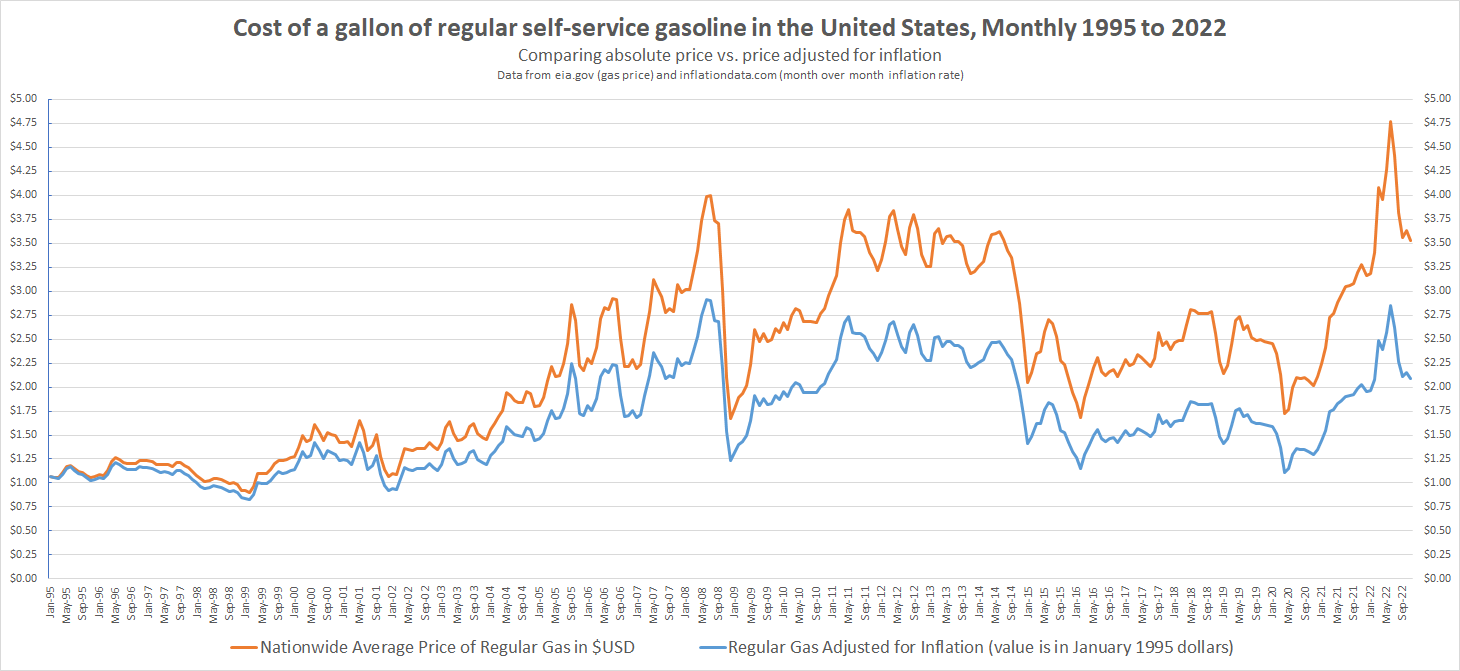 Average Price of Gasoline in the United States, Adjusted for Inflation, 1995 to 2022 [OC]
Birdy_Cephon_Altera t1_isz5h0q wrote
Reply to [OC] Pie chart of the countries that visited my website during the week with the most traffic by dptzippy
Pie charts and area charts can work well when there are two, three, four different data choices. Once you start to get above that, you can end up with tons of teeny slices like this, where it isn't possible to make a reasonable comparison between any two slices without having to look at the numbers.
One thing you could do is group them together into larger slices, so that all of the North America slices are the same general color and grouped together (maybe US a slight different shade of the same color from Canada), and group all of Europe together, etc. That way it doesn't end up looking like someone spilled a big box of crayons on the floor, and the colors have meaning.
Birdy_Cephon_Altera t1_jdx9gjp wrote
Reply to My first potato peeler (Sparschäler) I got this Sparschäler 10 years ago already used by my grand mother. It is still a mass product and you can buy it for round about 5 USD. But this one is made in West Germany so at least 33 years old and almost daily in use. by Secundus_Scipio
Mine I bought 35 years ago is this simple one. No need for fancy or pricey tools, sometimes simple does the trick and lasts a lifetime.