GeorgeDaGreat123
GeorgeDaGreat123 t1_j4d2463 wrote
Reply to comment by itsniickgeo in [OC] I tracked my spending for a whole year (2022). Every receipt was tracked in a monthly spreadsheet and I compiled this chart from there. My income shown is post-tax and after investment/saving account contributions. I get paid hourly and for overtime work. by ironicsharkhada
A lot of numbers here are confusing, especially for that retail expense. I would guess that the reason for the move was going from remote to in-office work. I have no idea why OP's housing costs fluctuate so much though, even if you include utilities.
GeorgeDaGreat123 t1_j4d05y3 wrote
Reply to comment by jointheredditarmy in USA Credit Cards: Card Balances v. Interest Rate [OC] by rosetechnology
The data source (St. Louis Fed) states "Credit Card Balances". Aren't all credit cards revolving by definition?
GeorgeDaGreat123 OP t1_j4133gz wrote
Reply to [OC] American confidence in the government, economy, and information has been declining by GeorgeDaGreat123
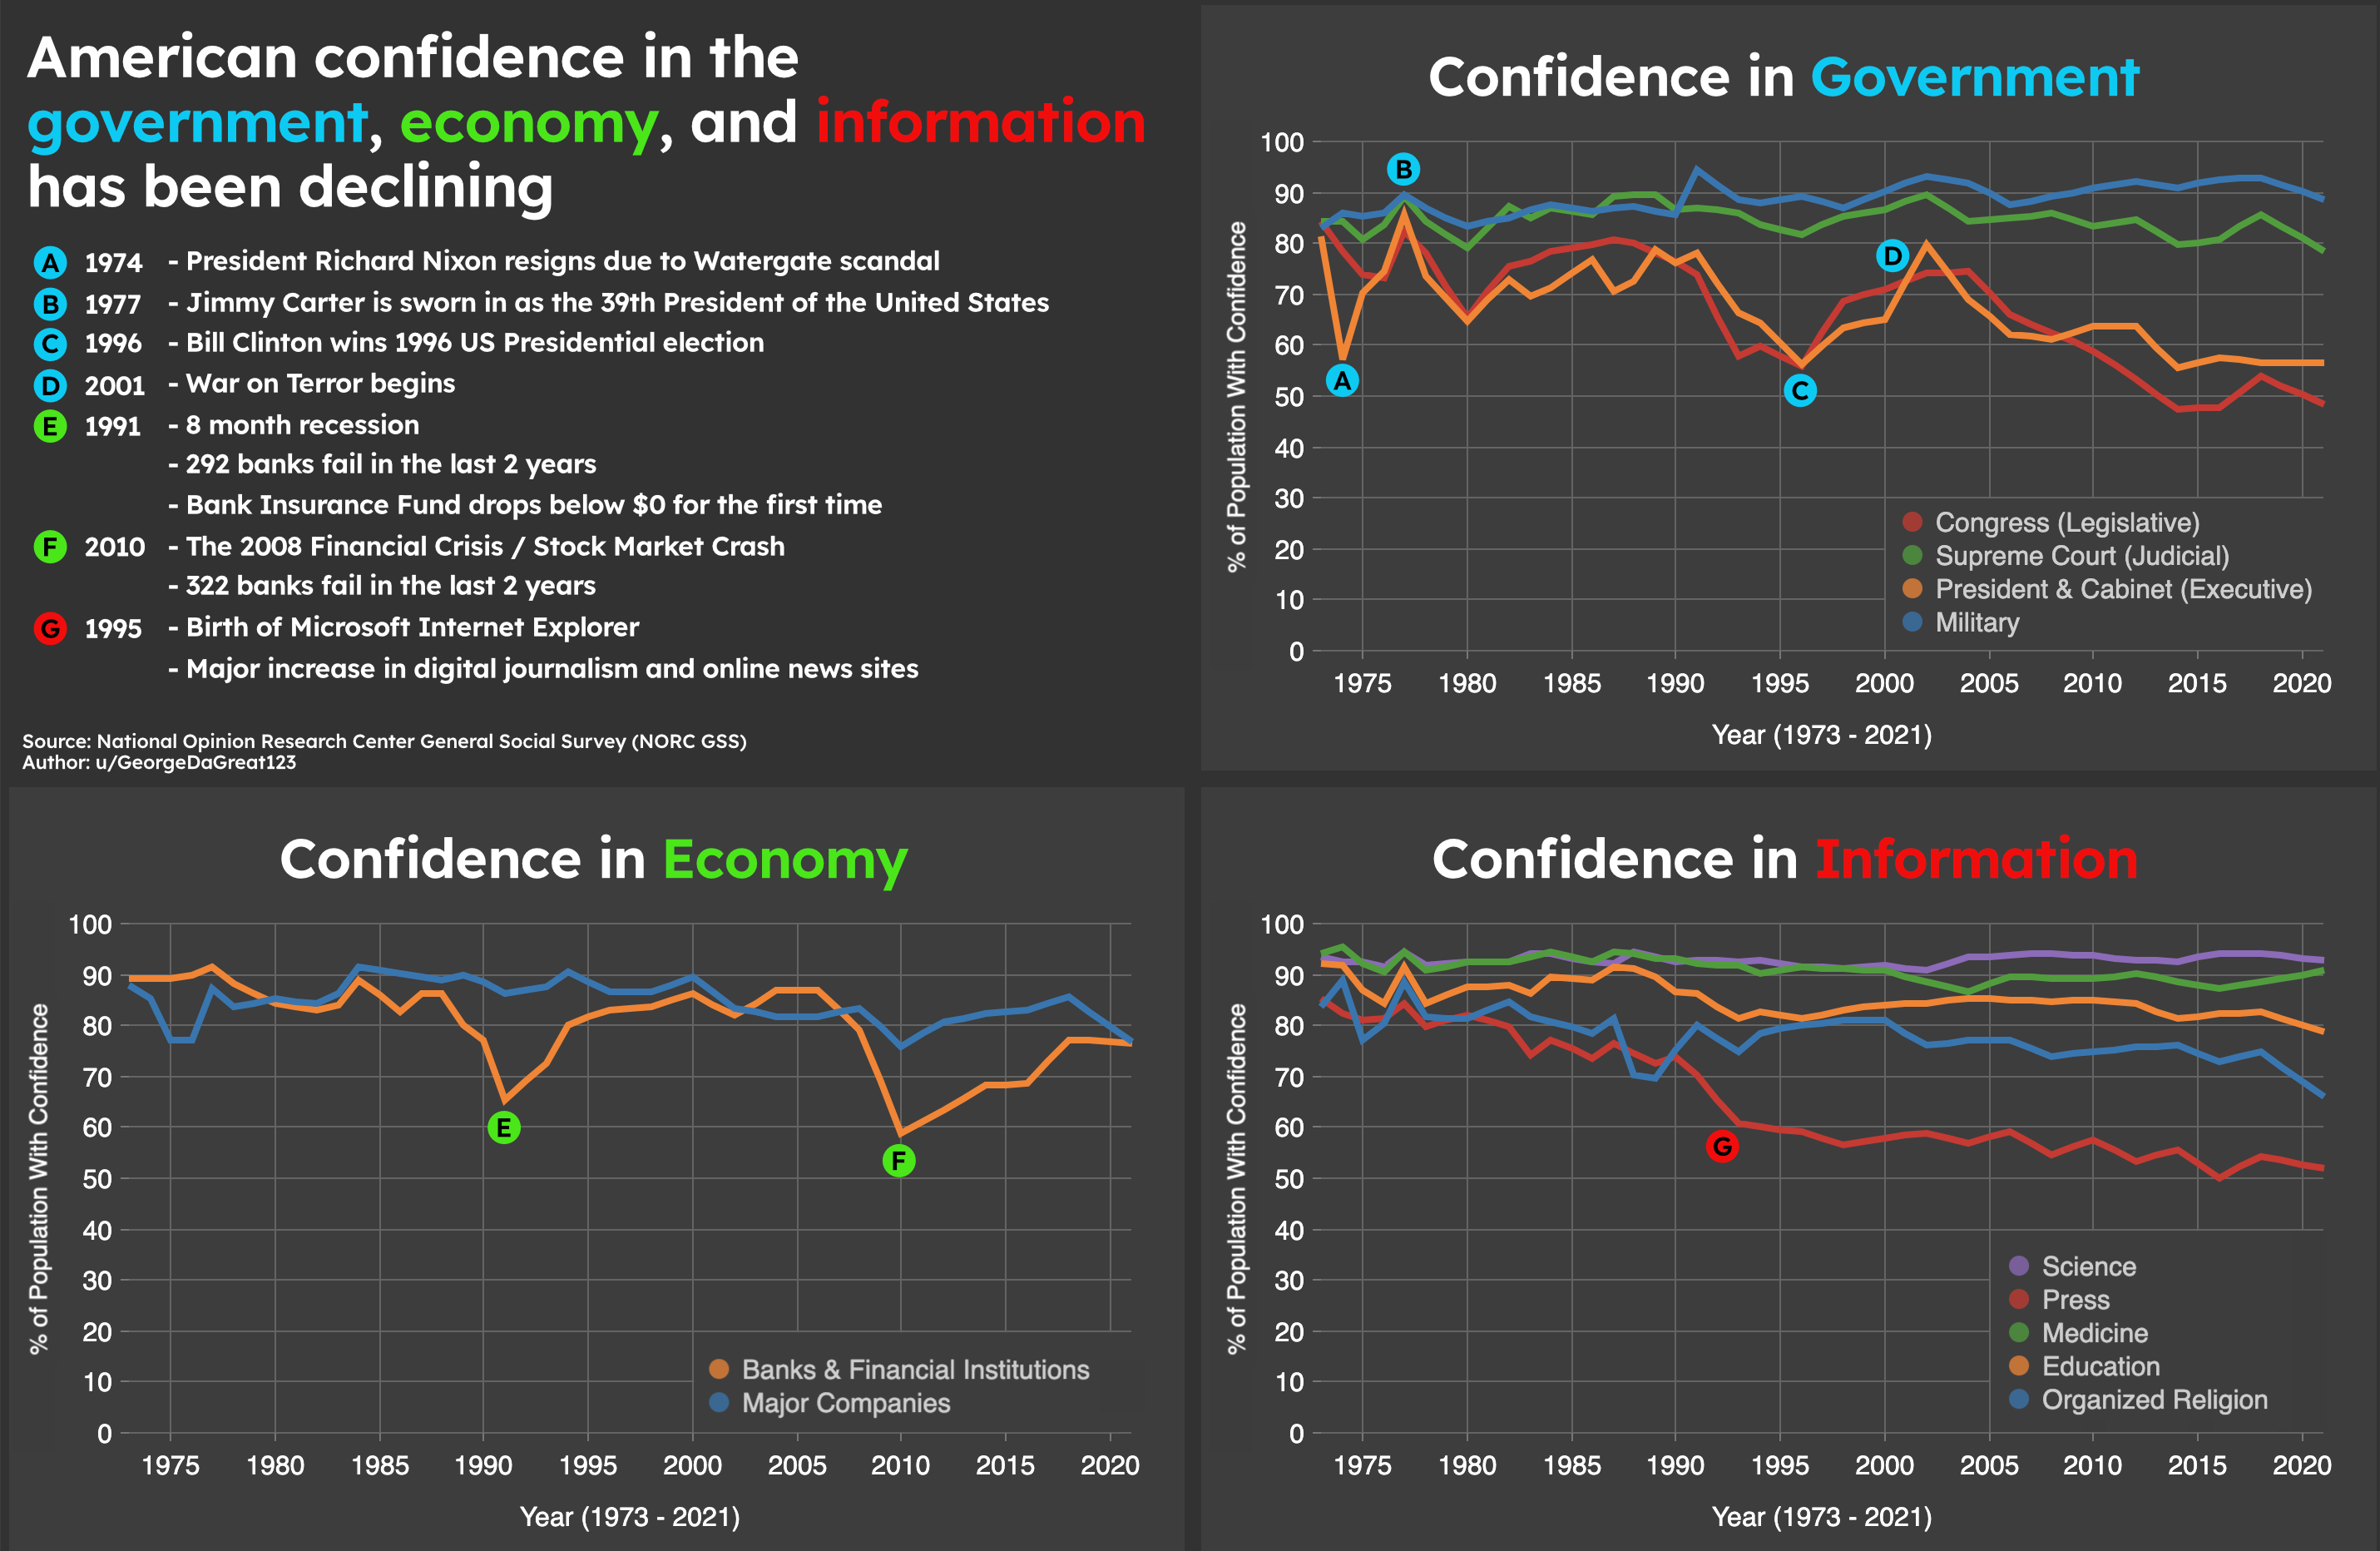
I find it really interesting how you can see the large drops in economic confidence during the financial crises and the decline of confidence in the press since the rise of the internet
GeorgeDaGreat123 OP t1_j412r2k wrote
Reply to [OC] American confidence in the government, economy, and information has been declining by GeorgeDaGreat123
Data Source: National Opinion Research Center General Social Survey (NORC GSS)
Tools Used: Microsoft Excel for data analysis, Node.js for data processing, React.js for data visualization. Affinity Designer for adding additional titles and labels.
 [OC] American confidence in the government, economy, and information has been declining
GeorgeDaGreat123 t1_j3k1lsd wrote
Reply to comment by indestructible_deng in Far East of Russia (population = 8m) and Helongjiang province of China (population = 31m) births, 1991–2021 [OC] by Populationdemography
OP linked a tweet of this graphic with such a message, which they promptly deleted.
GeorgeDaGreat123 t1_j3jet01 wrote
Reply to comment by anonkitty2 in Far East of Russia (population = 8m) and Helongjiang province of China (population = 31m) births, 1991–2021 [OC] by Populationdemography
That's fair, but it still wouldn't make this a valid comparison for what the author appears to be trying to show.
If I wanted to compare the change in population over time for the purposes of studying demographic, and I was looking at the US and Canada, unsure if they included Puerto Rico as part of the US data...I can't just take the population of Toronto and New York and extrapolate implying it represents something for all of Canada versus all of the US.
GeorgeDaGreat123 t1_j3jdcw6 wrote
Reply to comment by anonkitty2 in Far East of Russia (population = 8m) and Helongjiang province of China (population = 31m) births, 1991–2021 [OC] by Populationdemography
I'm not wondering why they don't split up Russia's far east. I'm wondering why they don't include Russia's population as a whole versus China's population as a whole.
GeorgeDaGreat123 t1_j3hxkzr wrote
Reply to Far East of Russia (population = 8m) and Helongjiang province of China (population = 31m) births, 1991–2021 [OC] by Populationdemography
Ah ok, so you're visualizing China's demographic threat. Is there a reason you're not just using Russia and China's total populations? From a Google Search, it seems that the Chinese province you used is "China's northernmost province, with remote mountain ranges" so it could just be that the Chinese in that province are moving to less remote, more urban Chinese towns/cities outside of that province.
GeorgeDaGreat123 t1_j3hw9he wrote
Reply to Far East of Russia (population = 8m) and Helongjiang province of China (population = 31m) births, 1991–2021 [OC] by Populationdemography
I'm a bit confused what this graph is meant to show. The data is easily understood but there are 30+ Chinese provinces, so I'm confused why you're choosing one specific one and comparing it to all of Russia's far east.
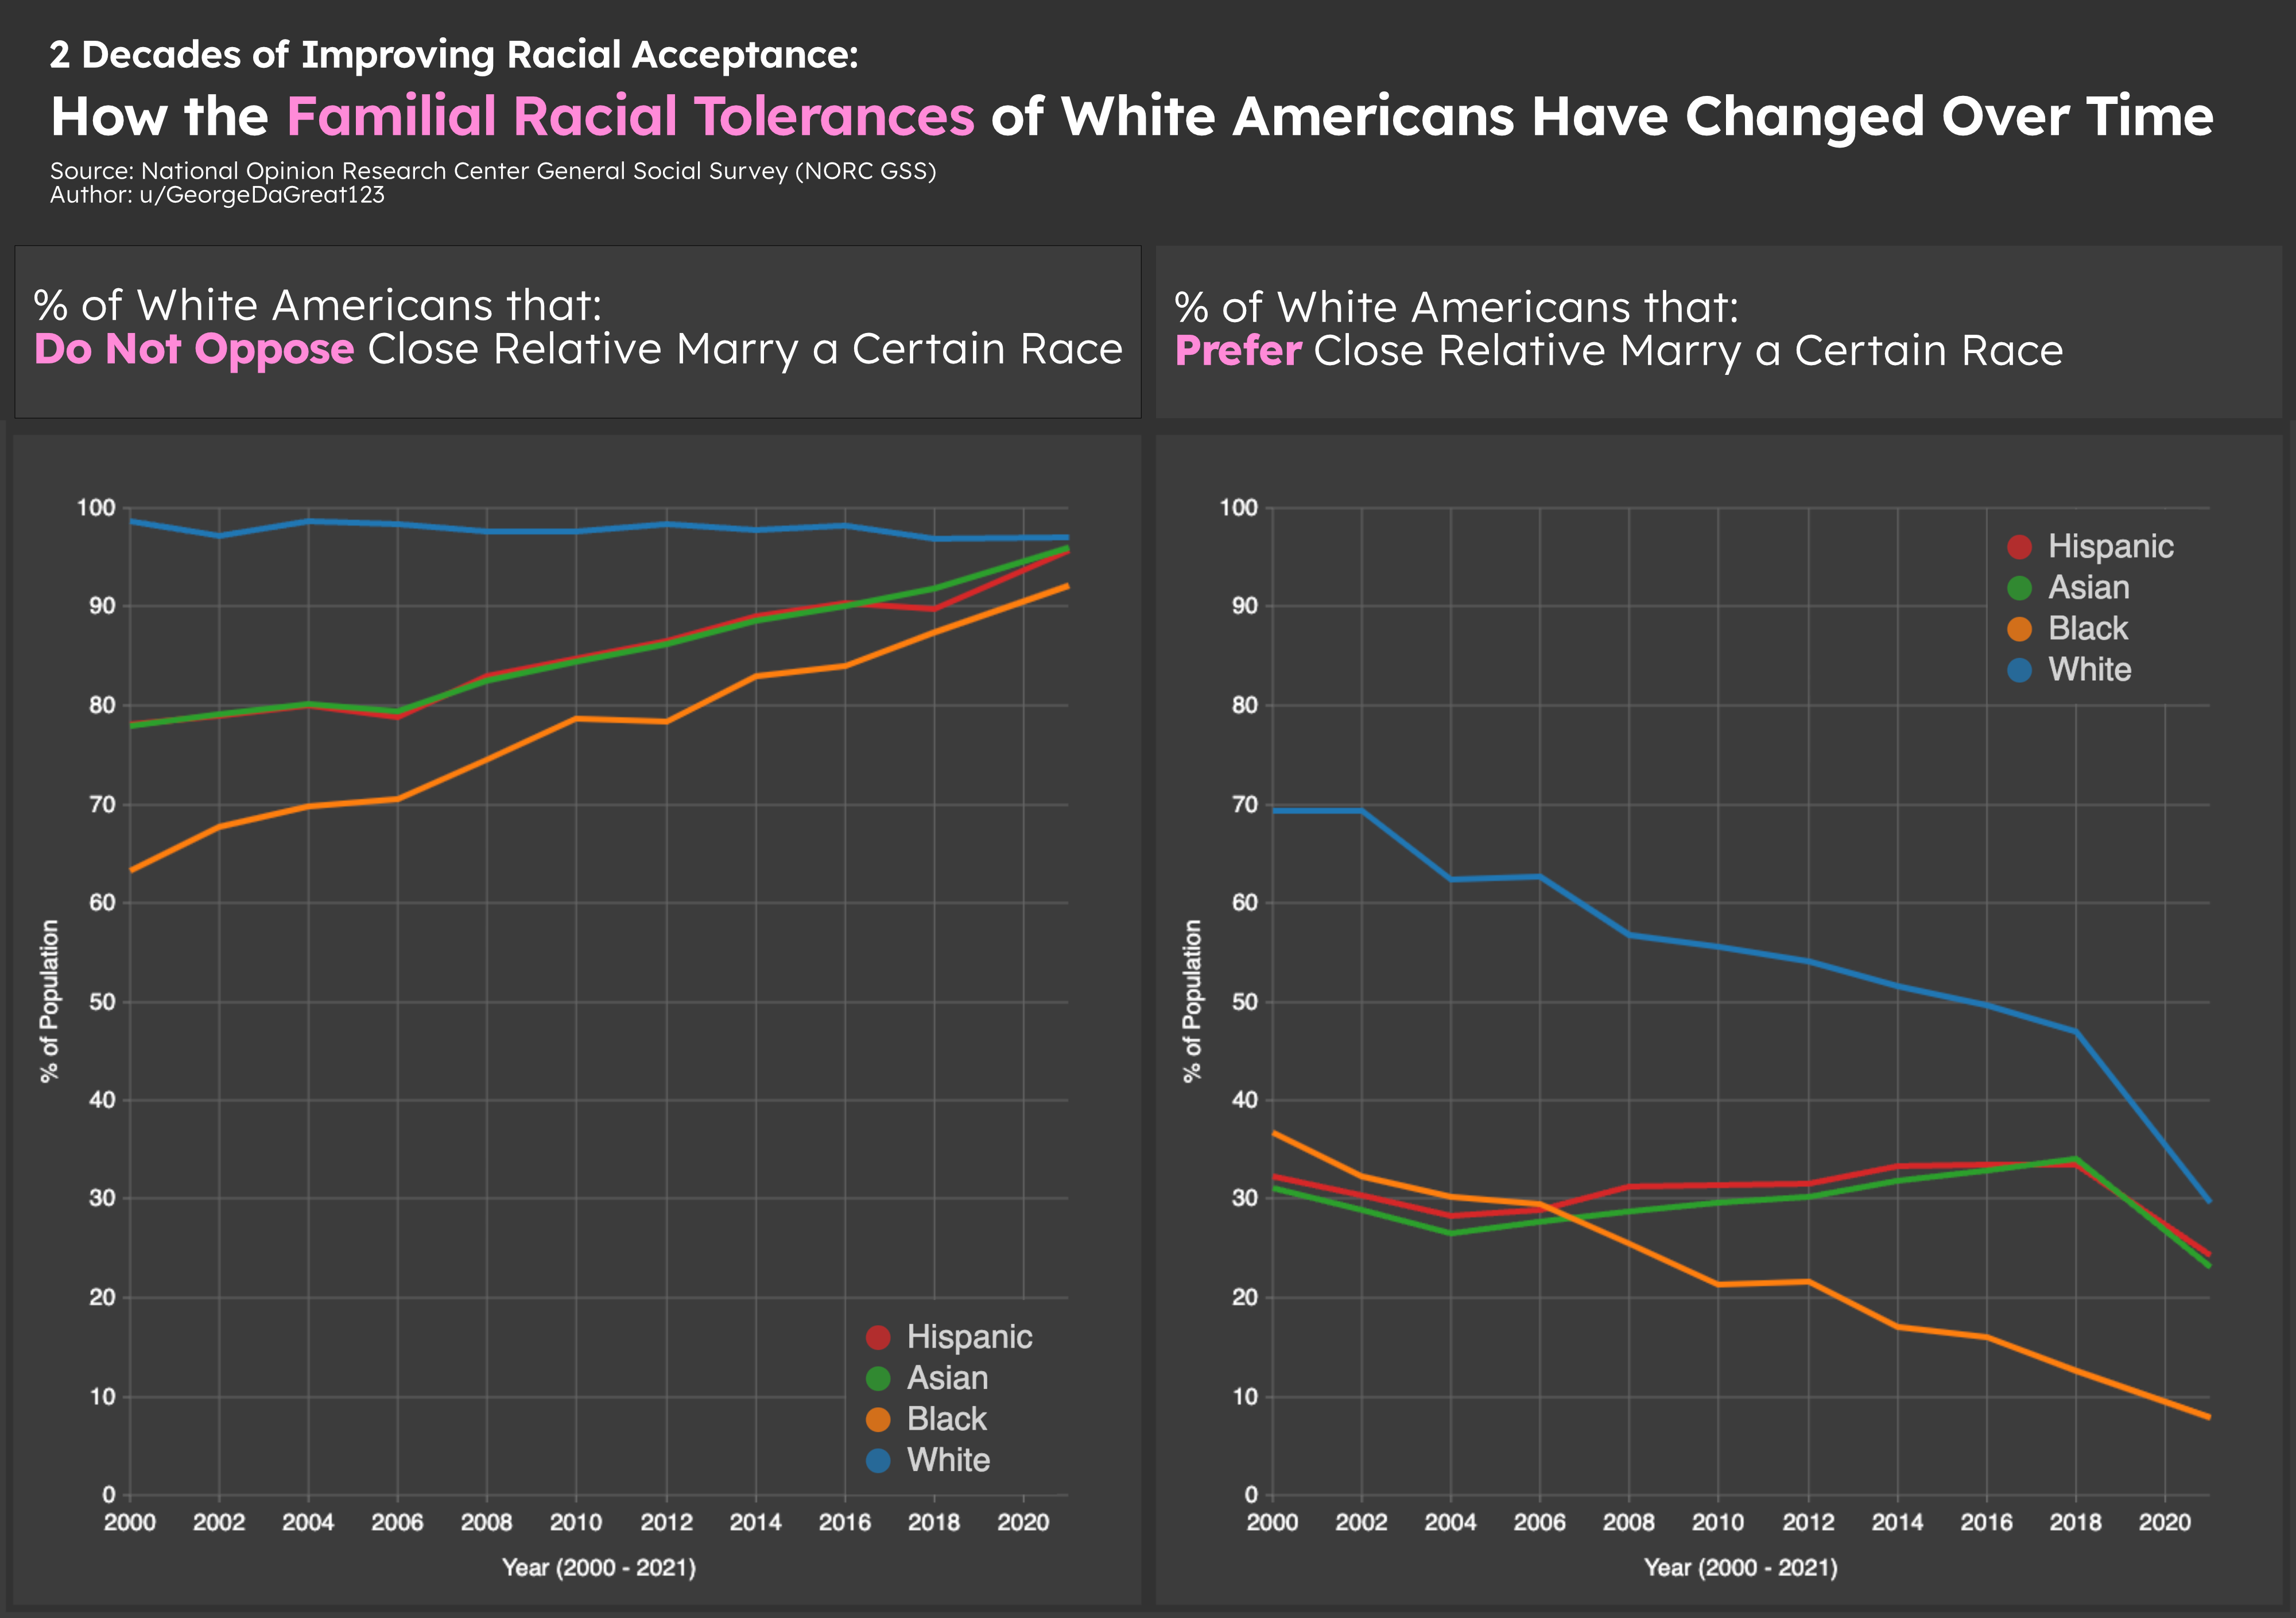 [OC] 2 Decades of Improving Racial Acceptance: White Americans Are Increasingly Open to a Close Relative Marrying Any Race
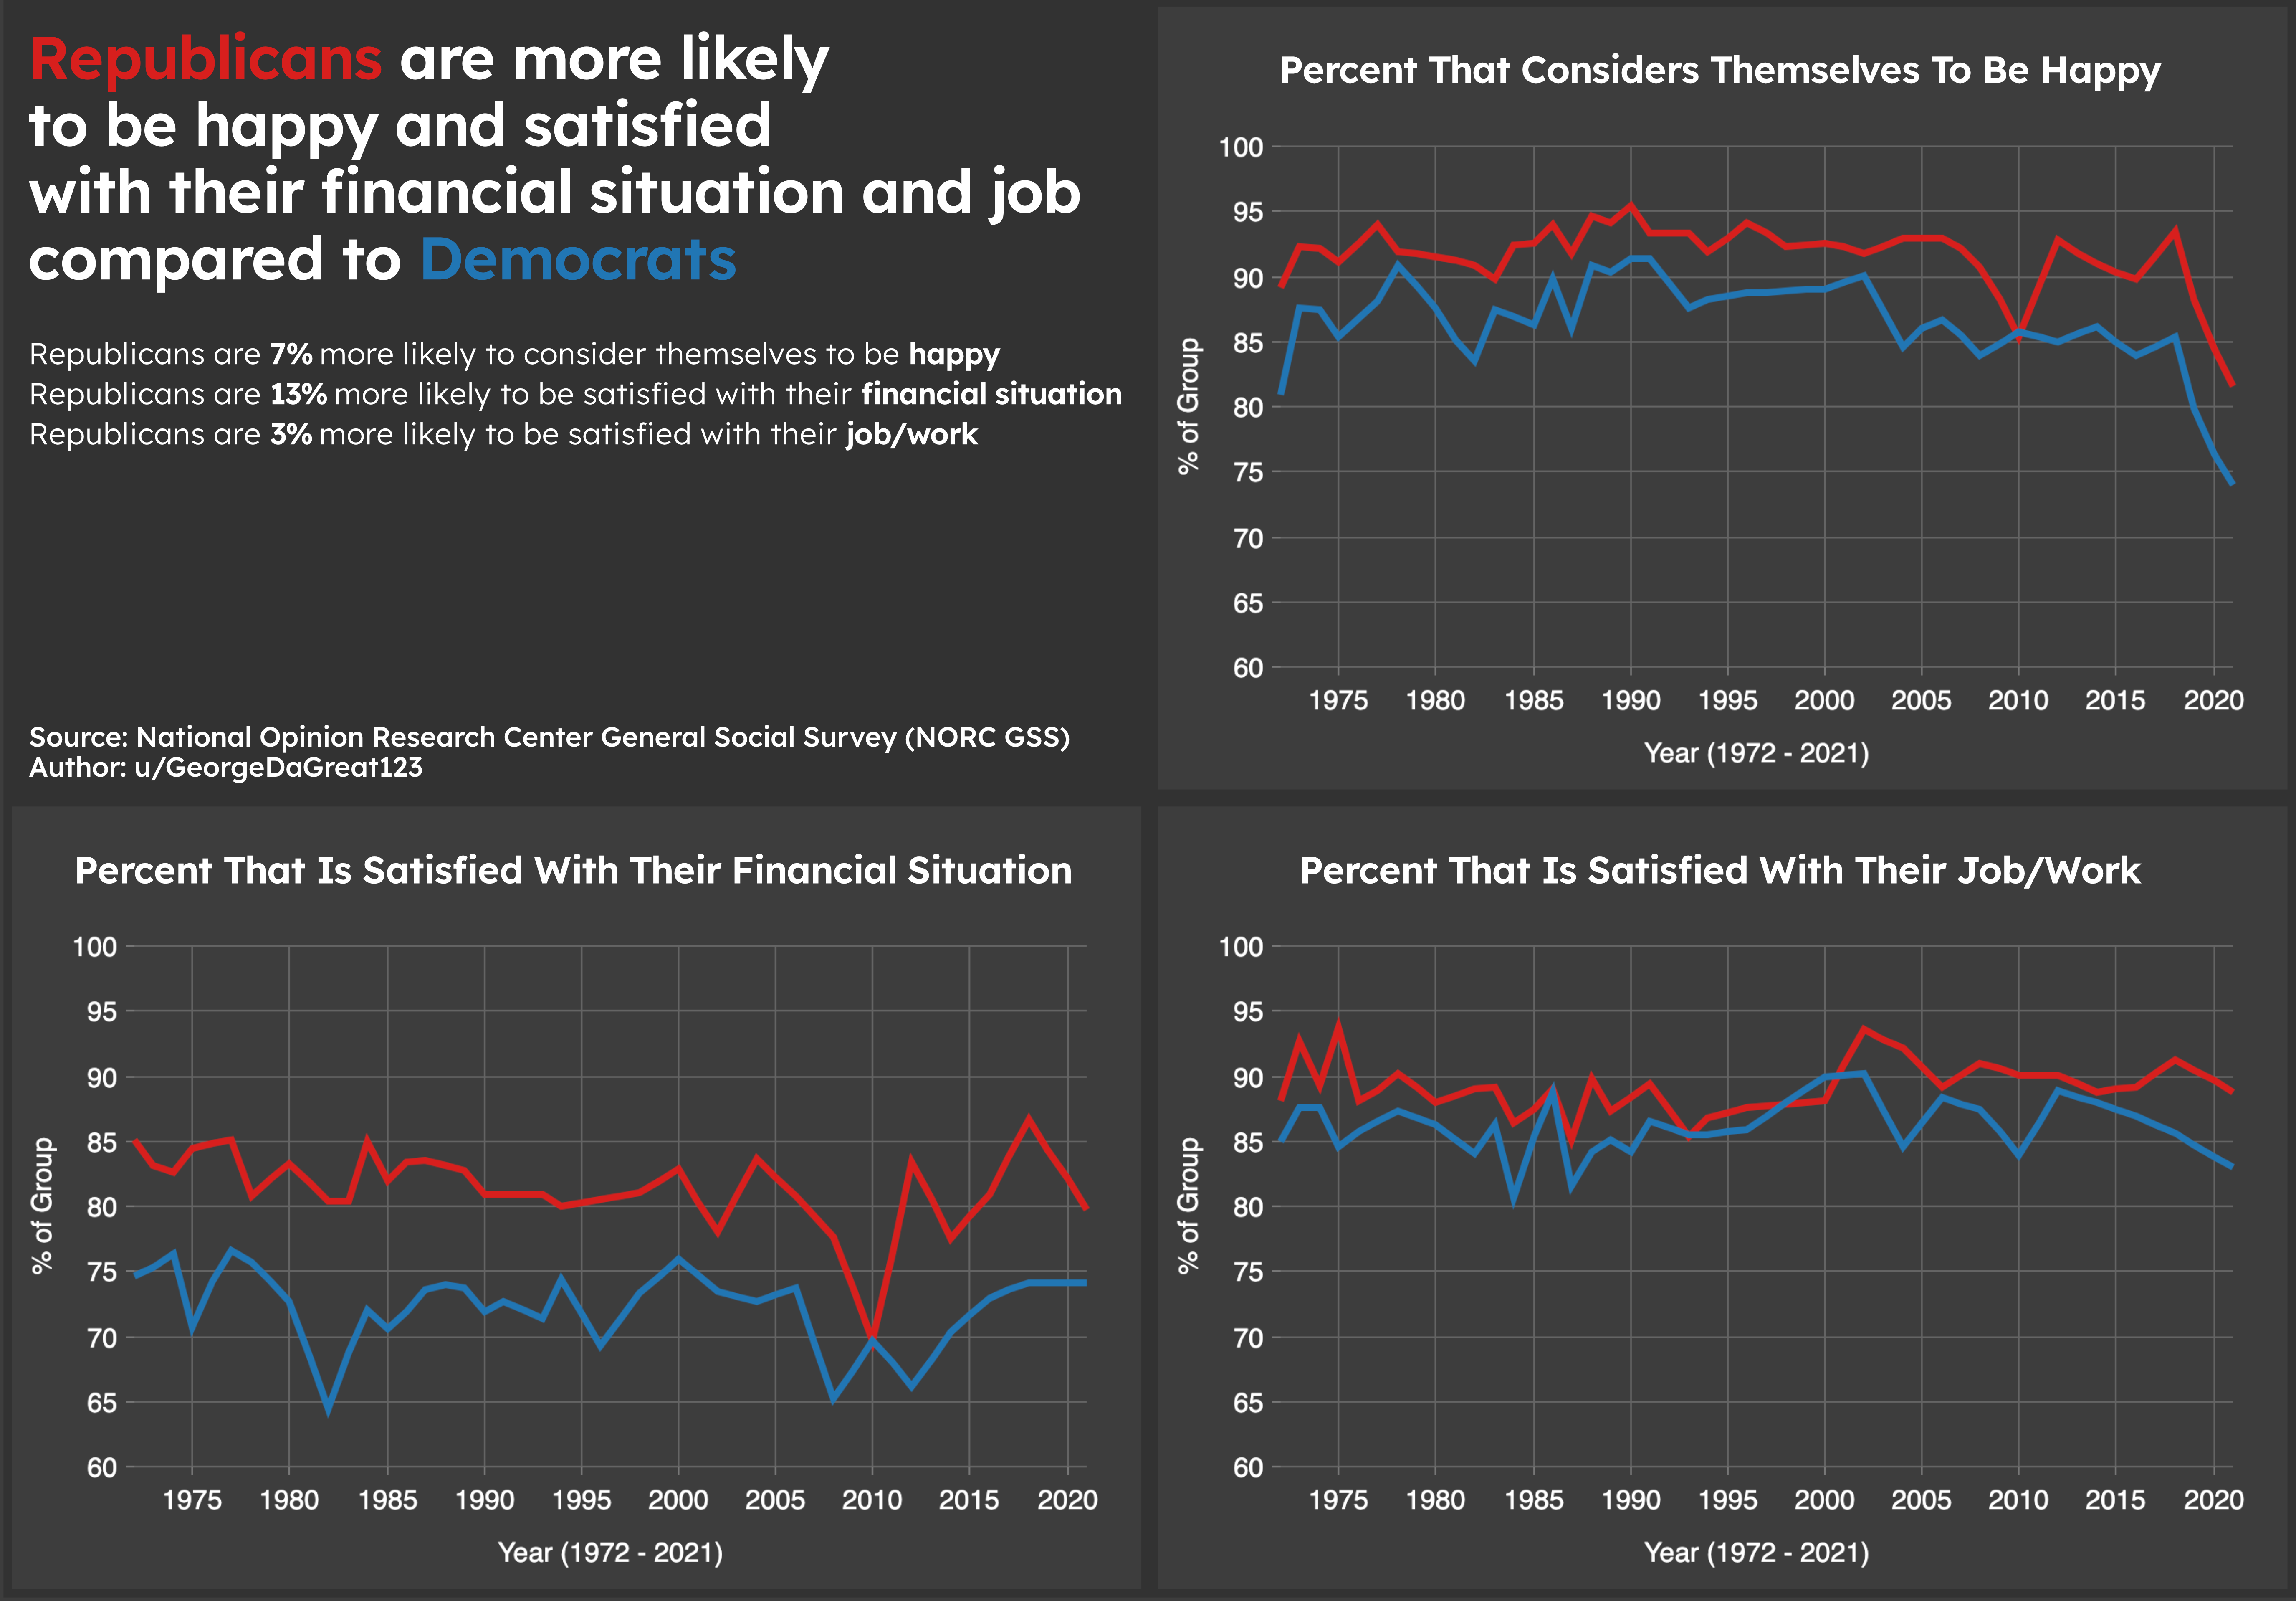 [OC] Republicans are more likely to be happy and satisfied compared to Democrats
Submitted by GeorgeDaGreat123 t3_103yggi in dataisbeautiful
GeorgeDaGreat123 OP t1_j30oknm wrote
Reply to comment by Acceptable-Work_420 in [OC] The richest billionaires in January 2023 (and how they got there, since 2020) by GeorgeDaGreat123
It's gone down 60% this year.
.
.
.
psst...shhh I'm not supposed to tell anyone so keep it quiet, but it flew from 189 trillion yen to 263 trillion yen this year. The rich get richer. :)
GeorgeDaGreat123 OP t1_j2xslf5 wrote
Reply to comment by AyyIsForApple in [OC] The richest billionaires in January 2023 (and how they got there, since 2020) by GeorgeDaGreat123
Kaguya says you're welcome :D
GeorgeDaGreat123 OP t1_j2rivn8 wrote
Reply to [OC] The richest billionaires in January 2023 (and how they got there, since 2020) by GeorgeDaGreat123
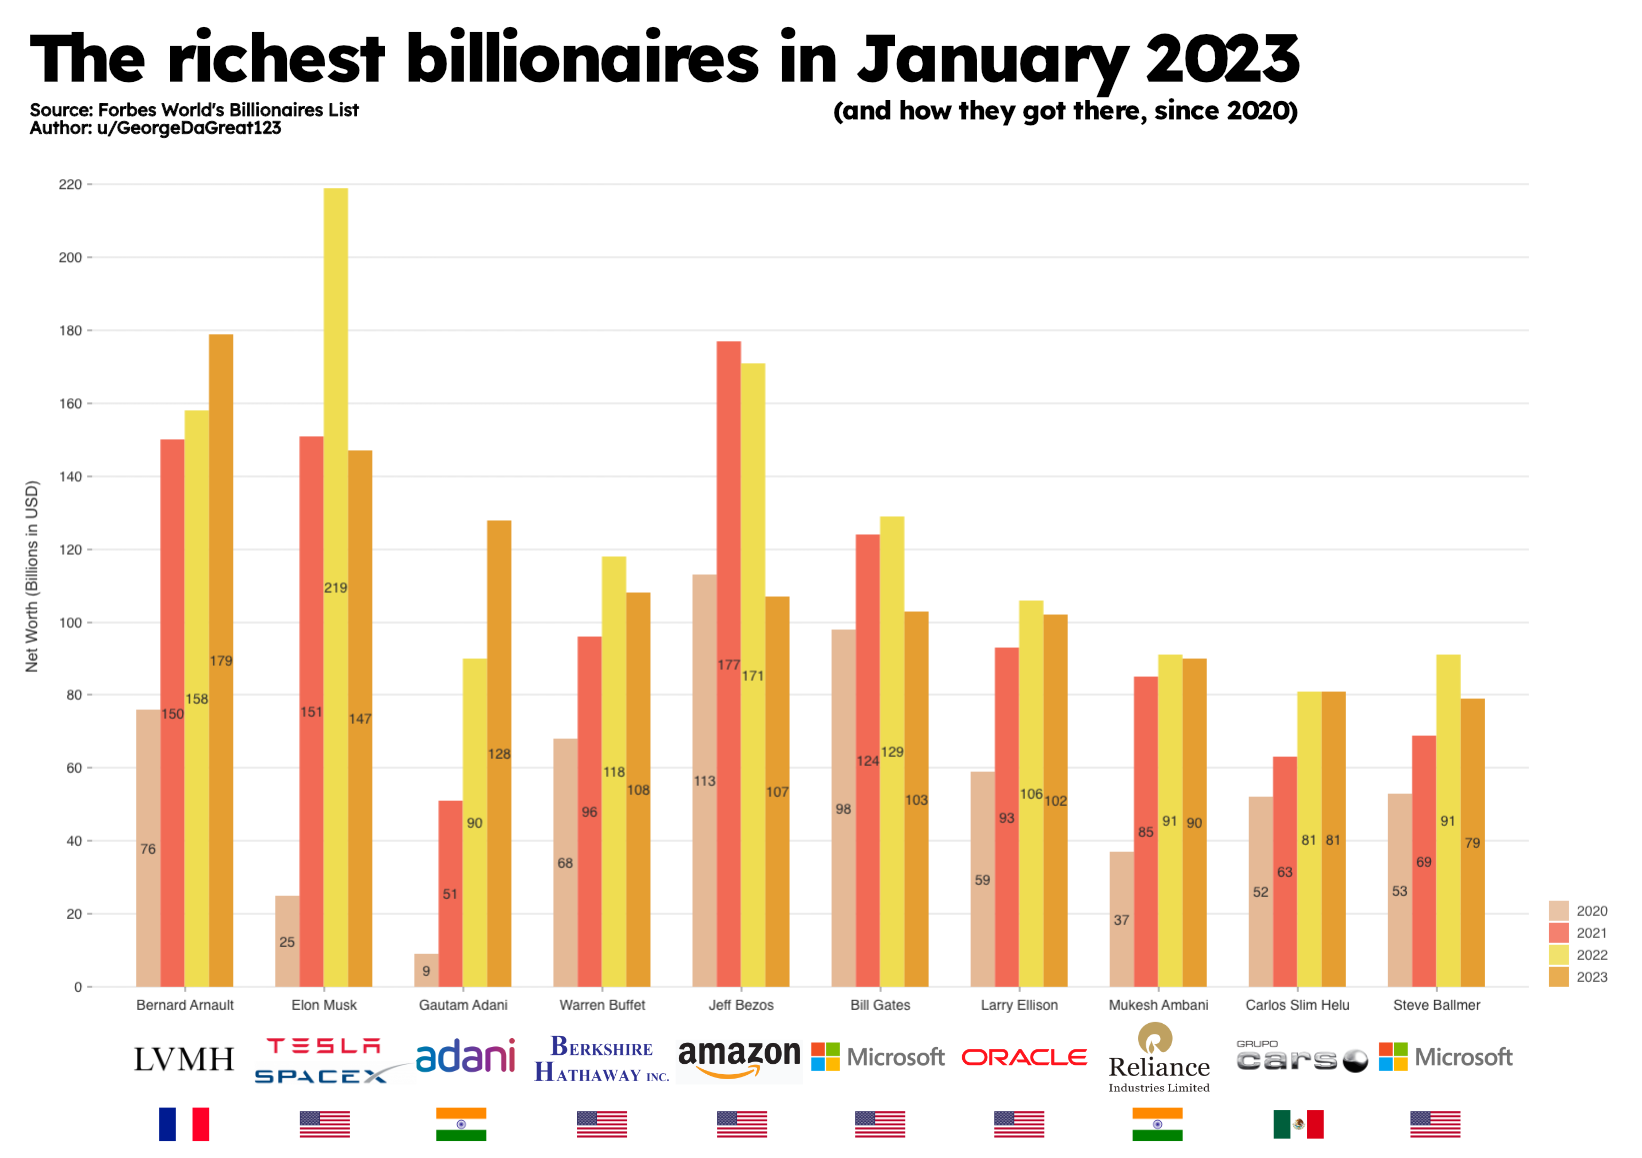
Data Source: Forbes World's Billionaires List
Tools Used: Node.js for data analysis/processing, React.js for data visualization. Affinity Designer for adding additional titles and labels.
A lot of wealth has been transferred in the past few years...first in 2020-2021 with the COVID-19 pandemic, and again now in the 2022-2023 recession. Searching online, I was surprised to find a few people on this list that I've never heard of before (Gautam Adani, Mukesh Ambani, Carlos Slim Helu). I created this graphic to visualize how today's top 10 billionaires net worth has been affected by all these changing economic events worldwide in recent years. The list is sorted descendingly from highest current net worth to lowest current net worth, as of January 2023).
 [OC] The richest billionaires in January 2023 (and how they got there, since 2020)
Submitted by GeorgeDaGreat123 t3_1027x9n in dataisbeautiful
GeorgeDaGreat123 t1_j2n5um6 wrote
Reply to [OC] Shrinkflation has hit my Breakfast Burrito last year. This is the last 7 years of Saturday breakfast burrito weight from the same restaurant. I have been tracking them in excel. You can see a covid dip between Jan - Aug 2020. by chiefd59
You've eaten the same breakfast burrito at the same restaurant every weekend for the past 7 years? Wow!
GeorgeDaGreat123 t1_j2fwveh wrote
Reply to Number of different clothing items being sold by the world's top 3 fast fashion brands by SauthEfrican
Cool visual, I knew Shein had a lot more variety, but seeing it visually is mind-blowing. Unfortunate that you're being downvoted but that's Reddit I guess. Thanks for sharing!
 [OC] What do Americans think about US military spending? (1973-2021, by political party & gender)
GeorgeDaGreat123 OP t1_j1urwjv wrote
Reply to comment by throw_somewhere in [OC] Women face greater Imposter Syndrome than Men, when starting Software Engineering Degrees, despite having similar high school averages by GeorgeDaGreat123
My team and I gathered data for this 50 question survey before I took that psych class. However, point taken. Thanks
GeorgeDaGreat123 OP t1_j1siyya wrote
Reply to comment by himmmmmmmmmmmmmm in [OC] Women face greater Imposter Syndrome than Men, when starting Software Engineering Degrees, despite having similar high school averages by GeorgeDaGreat123
as much as I like Silicon Valley, I have no idea what your point is
GeorgeDaGreat123 OP t1_j1s0xaq wrote
Reply to comment by himmmmmmmmmmmmmm in [OC] Women face greater Imposter Syndrome than Men, when starting Software Engineering Degrees, despite having similar high school averages by GeorgeDaGreat123
It collects data and everyone knows how to use it. I don't see a problem since analysis is done elsewhere.
GeorgeDaGreat123 OP t1_j1rhahd wrote
Reply to comment by himmmmmmmmmmmmmm in [OC] Women face greater Imposter Syndrome than Men, when starting Software Engineering Degrees, despite having similar high school averages by GeorgeDaGreat123
What's wrong with Google Forms?
GeorgeDaGreat123 OP t1_j1r8sys wrote
Reply to comment by jrm19941994 in [OC] Women face greater Imposter Syndrome than Men, when starting Software Engineering Degrees, despite having similar high school averages by GeorgeDaGreat123
Thanks for the comment. Sorry about that, little mistake on the face vs feel in the title there.
What you said would be really nice to measure. Unfortunately (or fortunately but let's not get into that debate), we don't have widespread use of standardized tests in Canada which makes these comparisons more difficult. I took a psychology course last year, and I'm nowhere near competent in that field but it's interesting to hear about your point of view regarding the potential correlation with the Big 5.
GeorgeDaGreat123 t1_j4dpcr8 wrote
Reply to comment by ironicsharkhada in [OC] I tracked my spending for a whole year (2022). Every receipt was tracked in a monthly spreadsheet and I compiled this chart from there. My income shown is post-tax and after investment/saving account contributions. I get paid hourly and for overtime work. by ironicsharkhada
That makes more sense. Why is retail so damn high?! I'm guessing the 4K is August was related to the move in July, maybe furniture or something, but I can't think of any other major expense in retail other than clothing and maybe electronics, but those are large non-recurring expenses. I find it hard to believe that you'd be buying nearly a thousand dollars worth of clothes every month, so it's probably a subcategory I'm not thinking of, but I have no idea what it is.